ES2544_Fast blind spectrum sensing method based on Determinant of Covariance Matrix

Fast Blind Spectrum Sensing Method Based on Determinant of Covariance
Matrix
Zhiqiang Bao , Qingdong Huang , YongZhi Zhai and Guangyue Lu School of Telecommunication and Information Engineering Xi’an University of Posts and Telecommunications
xi’an City, China
baozhiqiang@https://www.sodocs.net/doc/5815829770.html,,
huangqingdong@https://www.sodocs.net/doc/5815829770.html,,cesltsinghua@https://www.sodocs.net/doc/5815829770.html,, gylu@https://www.sodocs.net/doc/5815829770.html,
Abstract. Spectrum sensing is the key problem for cognitive radio systems. A fast blind sensing method based on Determinant of Covariance Matrix (DCM) of the received signals is proposed to sense the available spectrum for the cognitive users with the help of the multiple antennas at the receiver of the cognitive users. The greatest advantage of the new method is that it requires no information of the noise power and without any eigen-decomposition (or SVD) of sample covariance matrix. Both the simulation and the analytical results demonstrate that the proposed method is effectiveness and robustness.
Keywords: Spectrum sensing, cognitive radio, determinant, blind sensing 1. Introduction
Cognitive radio (CR) [1] has recently emerged as a promising technology to increase the spectrum utilization in wireless communications. In a CR network, secondary users (SUs) continuously sense the spectral environment, reliably detect weak primary signals over a targeted wide frequency band, and adapt transmission parameters (such as the transmitting power, modulation and coding scheme, carrier frequency, etc.) to opportunistically use the available spectrum. The typical sensing methods include the energy detector, the matched filter, the cyclostationary feature detection, and so on.
The typical sensing methods required the knowledge of noise power, LUs’ (License User) waveform or known patterns and signal cyclostationary feature. All the above methods need a subjectively pre-defined threshold, which affects the robustness of the methods.
Recently, some blind sensing algorithms are derived from the eigen-values of the covariance matrix. Among them, the detectors based on the sample covariance matrix, including the MME detector [2], MET detector [3], the information theoretic detector [4-5], and DMM detector [6], have been recently proposed. All of them work well in the case of noise uncertainty, and can even perform better than the ideal ED (with perfect noise power estimate) when the detected signals are highly correlated.
However, these methods suffer from the heavily computational load of the eigen-decomposition, which may be unacceptable in real-time signal processing and large-dimension array system. To deal with this problem, several fast blind sensing methods [7,8] based on covariance Matrix of the received signals is proposed, which requires no information of the noise power and without any eigen-value decomposition (EVD).
In this paper, we propose another fast and blind sensing method, which use the determinant of covariance matrix (DCM). We also derive the threshold of our detector based on Liapunov central limit theorem and Taylor expansion. Simulation and the analytical results demonstrate that the proposed method is effectiveness and robustness. 2. Blind Spectrum Sensing based on Determinant of Covariance Matrix
A. Array model and blind sensing algorithm based on Determinant. Multi-antenna is widely used in wireless communication due to its ability in improving the performance of the system. Here the multi-antenna is also served for sensing the LU signal.
Assume a uniform linear array is employed at the CR receiver side with M antennas. The array output data are
)()()()()()()(k k k k k i p
i i N s a N S A X +=+=∑=1θθ (1)
where )]()()([)(P θθθθa a a A "21= is the steering vector of the array, is the signal-vector, and is the noise-vector. The covariance Matrix of output data is
H 21)]()()([)(k k k k P s s s S "=)]()()([)(k K k k M n n n N "21=NN SS XX k k E R A R A X X R +==H H )()()]()([θθ (2)
where is the covariance of the signals, and H denotes the Hermitian Transpose.
is the noise covariance equal to in Gaussian white noise. Here, we only consider the Gaussian white noise situation.
)]()([k k E SS H S S R =)]()([k k E NN H N N R =I 2n σOnce the covariance of the received signals is obtained, we can derive our detection statistics.
1
c det()ln
trace()H XX M
XX H M γ>
=<
??????
R T R (3)
where is determinant of matrix, H det()?0 represents the absence of the LU signal and H 1 represents the presence of
the LU signal
In no signal case, the determinant of the covariance matrix is equal to ()M
2n σand
M
XX )
trace(R is the estimation of noise power . So the detection statistics T c is close to zero, and the threshold of detection statistics can be determined according to the distribution of noise covariance matrix’s determinant.
2
n σIn noisy case, we consider that the received signal at a secondary user is corrupted by the additive white Gaussian noise. According to the definition of determinant, it can seen that,
1det()M
XX i
i λ==∏R (4)
where i λis eigen-value of matrix XX R . In ideal case, the eigen-values of XX R can be expressed as followed
(5)
2n M 22n s 1λλλσσασ===>+="2Equation(3) can be rewritten based on eq.(5),
()()()
2(1)
22
c
2ln
ln
ln(1)ln(1SNR)
where SNR 22M 2s
n n s
n s M
222n
n n
s 2n
ασσσασσασασσσσσ
?++===+=+=
T (6)
If the SNR is big enough, we can always differentiate if there is a signal or not based on T c .
B. Theoretic analysis and the threshold determination. Although ()N R XX converges to as N tends to infinity, for finite N , its properties depart from those of the statistical covariance matrix, then the eigen-values of have the property that . At low SNR, the performance of a sensing algorithm is very sensitive to the threshold. Since we have no information of the signal (actually we even do not know if there is signal or not) and noise, it is difficult to set the threshold based on the P XX R XX R M 2P 1P p 21λλλλλλ>>>>>>>++""d . Hence, usually we choose the threshold based on the P fa . We need to determine the behavior of determinant of covariance matrix under null hypothesis, i.e., 0Η. To derive the threshold, the distribution of test statistics must be derived. Firstly, we start from the following definition.
Definition 1[9]: The random matrix m m ×H XX A =is a (central) real/complex Wishart matrix with n degrees of freedom and covariance matrix Σ, (), if the columns of the ),(~ΣA n W m n m × matrix are zero-mean independent real/complex Gaussian vectors with covariance matrix X Σ. The p.d.f. of a complex Wishart matrix for is
),(~ΣA n W m m n ≥[]m n m
i n
m m tr i n f ??=????=
∏
B B ΣΣ
B A det }{exp )!
(det )(11
2
/)1(π (7)
Lemma1[9]: Assume for and , then ),(~ΣM n W m m n ≥0>Σ∏=m
i i M 1)det(~)det(u Σ, where , which independent for different i and is chi-square distribution with n degrees of freedom.
m i i n i ,,2,1,~21"=+?χu 2n χPractically, the statistical correlation matrix in the detection statistics is estimated through a sample covariance matrix. Introduce N as the number of samples collected by each receiver during the sensing period. The M ×M sample covariance matrix is then de ?ned as
XX R ()N R XX
()∑==
N
k k k N
1
H
)()(1X
X N R XX (8)
In the noise case of H 0, it is not hard to verify that ()N R noise follows a central Wishart distribution
(),
(~2N
I
N W N M noise σN R (9)
According to lemma1, we can derive the p.d.f of , which is the key for determination threshold of our
algorithm.
)det(XX R ()∏∏=?=?=M
i i M
N
M M
i i N noise N I N 12121)det(~)det(u u N R σσ (10)
From eq.(10), the distribution parameters of multiplication of several chi-square distribution, is hard to determine. But with logistic operation and Liapunov central limit theorem, we know that the test statistics approach Gaussian distributions with large M.
[]()()[]21c 221det(())
det(())E E ln
E ln E ln E ln ln trace(())M M M M
N i i XX XX i M
M M i XX
n n N N N M N N M σσσ?==??
?
???????????=≈==??????????????
????????
∏∑u R R T u R ? (11)
[]()()[21c 221det(())
det(())D D ln
D ln D ln D ln trace(())M M M
M N i i XX XX i M
M M i XX
n n N N N N M σσσ?==?
?
?
???????????=≈=??????????????
????????
∏∑u R R T u R ]= (12)
The parameters of distribution are obtained through 2-order Taylor expansion at []x x E ==μ. Let ()()x ln x h =,
()()()()()()()()23
311h ln h h h O(()26
x x x x )x μμμμμμμμ′′′′′′=+?+?+?+? (13)
So the mean and variance of can be computed as followed.
i u ln ()()()()()22
1E ln x ln h E ln 22D()x x μμμμμ′′≈+?=????? (14) ()()()()()()()()()()()[]()()()()()2
222
2
22
442321D D ln x E ln h h ln 22D()1h E h E 44E ()1h h E h 2()1x x x x x x x D x x μμμμμμμμμμμμμμμμμμ
?′′′≈+?+??+????????
????′′′=?+?+???????????????????′′′′′+?+?? (15) And with some results below we can get the mean and variance of our test statistics.
[][]()
[]()[]()[]
E 1D 21E E 2(1)E 2(2)...E i i k
i i i N i N i k k =?+=?+??=+?+???u u u u u i u (16)
According to the analysis above, we can derive the threshold of our algorithm based on false alarm probability.
()()f P Pr Q c T αγγ=>= (17)
where
(
)2()2Q u t
t e
μσ??+∞
=
∫du (18)
It can be seen that the threshold has nothing to do with the knowledge of noise power and signal information, therefore our method is belong to blind sensing algorithm.
2n σC. Remark. To compute the determinant of matrix, our method and CDC [8] merely requires 33n flops [10]. However the EVD-based algorithms require flops (only for computing eigen-values)[10]. Thus the computation complexity of our method is significantly reduced.
34n 3. Simulation results
To demonstrate the performance of the proposed methods, simulations are provided. A Uniform Linear Array (ULA) is used here with M = 8 sensors and half wavelength inter-element spacing. The QPSK signals are used in the simulations.
In the simulations, the definition of SNR is ()22
1010log s n σσ for conveniently. In the following, all the results are averaged over 100000 Monte Carlo realizations.
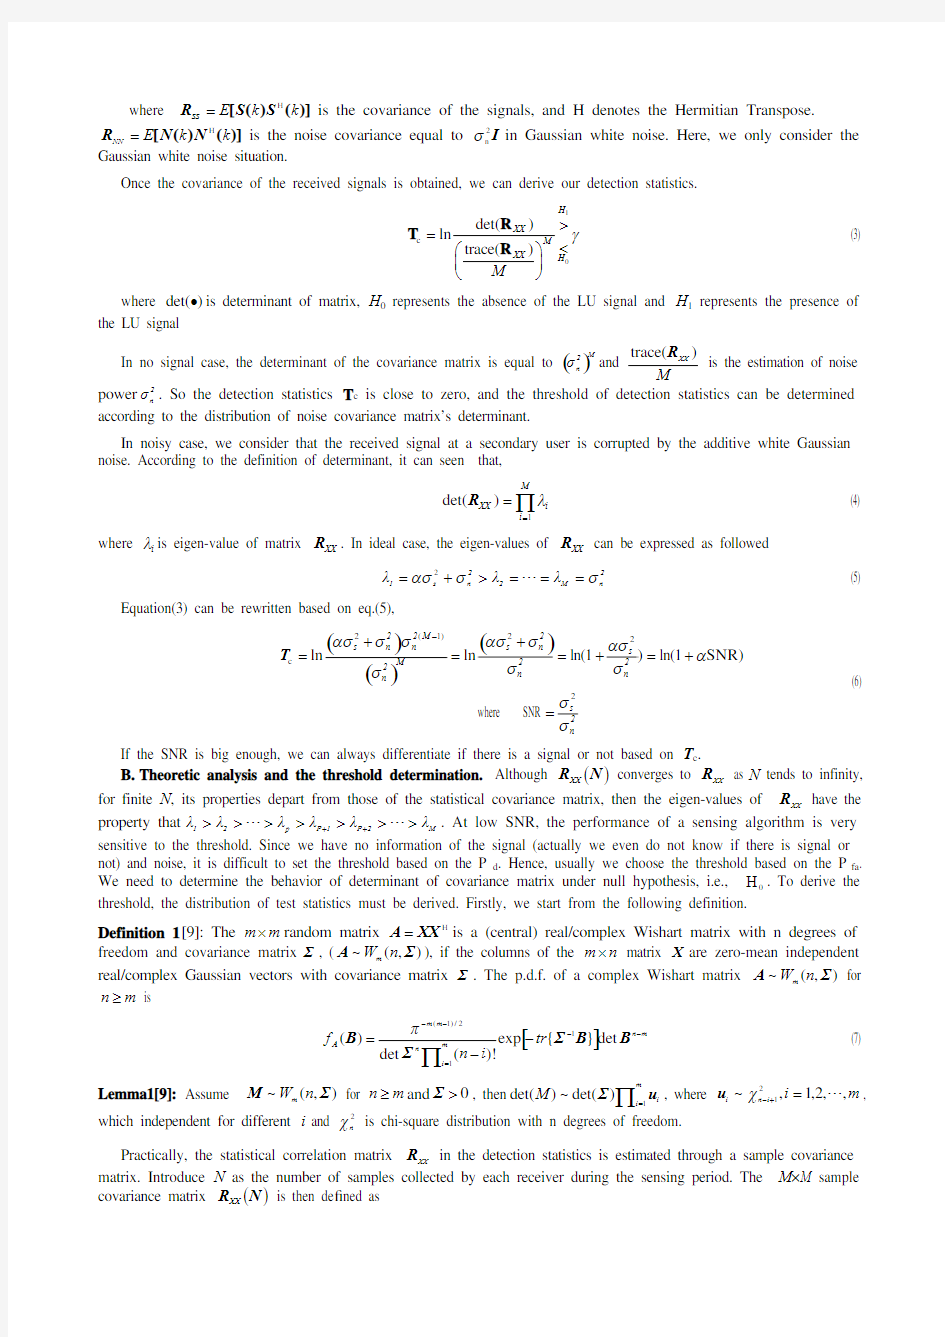
Fig.1 shows the statistical distribution of our method under H 0 and H 1. In the left part of the figure, there is distribution only in noise case; we can see that the theoretical distribution coincides with statistical distribution. In the right part of the figure, there is the distribution of noisy signal with SNR=-6dB, which separate well with noise only case.
0500100015002000250030003500
4000Threshold
Fig1. The statistical distribution of our method under H 0 and H 1
SNR(dB)
P d
SNR(dB)
P d
(a)Pfa=0.01, N =1024 (b) Pfa=0.01, N =40
Fig.2 Performance comparison of DCM, CAV, CDC and MME methods
Fig.2 shows the comparison the performance of our DCM detector, CAV detector [7], CDC detector [8] and MME detector [2]. The given Pfa is 10-2 and the number of samples are 1024 and 40 separately. It is clear that, DCM, CDC and MME methods are well done at low SNR for large samples. For example, when SNR=-7dB and samples is 1024, P d of DCM, CAV, and CDC methods are 82%, 74% and 86.5%. It is clear that MME detector is the best for large samples,
and our DCM method slightly better than CDC methods in both large and small samples, CAV method is the worst. And also the computation complexity of our method and CDC are greatly reduced compared with the eigen-based methods.
Samples
D i s t a n c e (d B )
Fig.4 Comparison of distances between theoretical and experimental threshould
To evaluate the effectiveness of theoretical threshold, fig.4 gives the distance of theoretical and experimental thresholds of these four methods in different sample numbers. It is clear that the distances of CAV and MME detector are much larger than our DCM and CDC methods, and greatly degraded with small samples, which because of threshold determination based on the asymptotic assumption that the sample size is infinite. From eq.(9) and (10), it can be seen that our method overcomes the inaccurate threshold resulting from the asymptotic assumption. So our DCM detector and CDC detector work well in small samples situation.
4. Conclusions
This paper proposes a fast and blind spectrum sensing method based on the determinant of the received signal covariance matrix. The employed test statistic requires no information of the noise power and without any eign-decomposition (or SVD). And our method also has the robust theoretical threshold, which unsensitive with sample size. The simulation results demonstrate its effectiveness and robustness.
5. Acknowledgment
This work was supported in part by the Natural Science Research Program of Shaanxi’s Provincial Education Department (11JK0925), the Nature Science Foundation of China (60602053), Program for New Century Excellent Talents in University (NCET-08-0891), the Natural Science Foundation of Shaanxi Province (2010JQ80241),the Natural Science Foundation of Hubei Province (2009CDB308) and the Fund from Education Department of Shaanxi Government.
References
[1]
Haykin S. Cognitive radio: brain-empowered wireless communications. IEEE J. Select. Areas Commun., 2005, 23(2): 201-220.
[2] Zeng Y H and Liang Y C. Eigenvalue based spectrum sensing algorithms for cognitive radio. IEEE Trans.
Commun., 2009, 57(6): 1784-1793.
[3] Zeng Y H, Liang Y C and Zhang R. Blindly combined energy detection for spectrum sensing in cognitive radio.
IEEE Signal Process. Lett., 2008, 15: 649-652.
[4] Rui W and Meixia T. Blind Spectrum Sensing by Information Theoretic Criteria for Cognitive Radios. IEEE
transactions on vehicular technology, 2010, 59(8): 3806-3817.
[5] Zayen B, Hayar A and Nussbaum D. Blind spectrum sensing for cognitive radio based on model selection.
CrownCom 2008, 3rd International Conference on Cognitive Radio Oriented Wireless Networks and Communications, Singapore, May, 2008: 15-17.
[6] Yingxi W, Guangyue L. DMM Based Spectrum Sensing Method for Cognitive Radio Systems. Journal of
Electronics and Information Technology, 2010, 32 (11): 2571-2575.
[7] Zeng Y H and Liang Y C. Spectrum-sensing algorithms for cognitive radio based on statistical covariances. IEEE
Trans. Veh. Commun., 2009, 58(4): 1804-1815.
[8] Yang X, Lei K J, Peng S L and Cao X Y. Blind Detection for Primary User Based on the Sample Covariance
Matrix in Cognitive Radio. IEEE communications letters, 2011, 15(1): 40-42.
[9] Anderson TW. An introduction to multivariate statistical analysis. 2nd
ed. New York, USA: New York Press,1984.
[10] Golub G H and Van Loan C F. Matrix Computations. 2nd
ed. Baltimore, MD: John Hopkins Univ. Press, 1989.
化学分子式查询(CA)
化学分子式查询(C A) https://www.sodocs.net/doc/5815829770.html,work Information Technology Company.2020YEAR
CA(美化学文摘)网络版数据库使用说明 一、数据库简介 CA(Chemical Abstracts)由美国化学文摘社(CAS--Chemical Abstracts Service)编辑出版,是涉及学科领域最广、收集文献类型最全、提供检索途径最多、部卷也最为庞大的一部著名的世界性检索工具。CA报道了世界上150多个国家、56种文字出版的9500多种科技期刊、科技报告、会议论文、学位论文、资料汇编、技术报告、新书及视听资料,摘录了世界范围约98%的化学化工文献,所报道的内容几乎涉及化学家感兴趣的所有领域。 SciFinder Scholar数据库为CA(化学文摘)的网络版数据库,收录内容比CA更广泛,功能更强大。利用现代机检技术,进一步提高了化学化工文献的可检性和速检性,更整合了Medline医学数据库、欧洲和美国等50几家专利机构的全文专利资料、以及化学文摘1907年至今的所有内容。它涵盖的学科包括应用化学、化学工程、普通化学、物理、生物学、生命科学、医学、聚合体学、材料学、地质学、食品科学和农学等诸多领域。它可以透过网络直接查看“化学文摘”1907年以来的所有期刊文献和专利摘要;以及八千多万的化学物质记录和CAS注册号。 SciFinder Scholar可检索数据库包括: CAplusSM:包含来自 150 多个国家、9000 多种期刊的文献,覆盖1907 年到现在的所有文献以及部分1907 年以前的文献,包括有期刊、专利、会议录、论文、技术报告、书等,涵盖化学、生化、化学工程以及相关学科,还有尚未完全编目收录的最新文献。(目前>2,430 万条参考书目记录,每天更新3000 条以上) MEDLINE?:包含来自 70 多个国家、3900 多种期刊的生物医学文献,覆盖1951 到现在的所有文献,以及尚未完全编目收录的最新文献。(目前>1300 万参考书目记录,每周更新4 次)
《化学文献检索》知识点总结
《化学文献检索》 第一章绪论笔记 第二章期刊笔记 第三章题录索引 美国《化学文摘》Chemical Abstracts(CA) 一、C A概况 CA的出版者和创刊年二次文献 CA创刊于1907年,由CAS即Chemical Abstracts Service,美国化学文摘社创办。 CA的收录范围 收录世界各国化学化工方面的出版物约20,000余种,包括期刊论文、会议录、资料汇编、报告、新书、专利等,CA被称为“世界化学化工文献的钥匙”。 出版周期频率 CA是周刊,半年一卷,一卷26期。 载体形式 印刷版----手工检索光盘版----计算机检索网络版----计算机检索CA特点 1 收录内容广泛,文献量多。 2 CA是可得性和可用性很好的二次专利文献源。CA可帮助查找大量专利文献。 3 CA印刷版的平均时差不超过3个月,报道及时 4 CA索引索引齐备,有完善的期索引,卷索引和累积索引,方便查找。 CA正文的编排结构和著录格式: CA正文由(文摘主体)和(期索引)两部分组成。 文摘主体部分(分为五大部分共80大类,分单、双周出版) 单周1、生物化学2、有机化学 双周3、高分子化学4、应用化学和化学工程5、物理化学和分析化学 CA的编排格式 早期的CA每页通栏编排(1-27卷)后来的CA每页分左右两栏,每条文摘都有一个文摘号
CA的著录格式 期刊论文文摘的著录格式 126: 1939m (1) Use of antivirals in influenza in the elderly Prophylaxis and therapy. (2) Nichoson. Karl. (3) (Department of infectious disease ..,UK) (4) Gerontology( Basle) (5) 1996,42(5),280-289 (6) (English) (7) 期刊论文文摘的著录格式各部分意义: ①卷号和文摘号,同一卷连续编号。 ②篇名,非英语文献篇名按原意翻译成英文。 ③著者姓名。 ④著者的工作单位或论文寄发单位。 ⑤⑥文献出处,刊名大多用缩写,全称可查“CAS Source Index”. ⑦原文献语种。 CA中的一条文摘: 各个编号代表的意思:1卷文摘号2标题3作者4作者所在单位5期刊名缩写6年份7卷期号8页码9文种缩写 专利文献的著录格式 126:139853u Process for identifying RAR receptor antagonists using skin test application of RAR agonist. 专利标题 (1) Demarchez, Michel; Jomard, Andre 专利发明人 (2) (Centre International De .........,Fr) 专利权人 (3) Eur.Pat.Appl.EP749,755 专利国别和专利号 (4) (CL.A61K49/00) 国际专利分类号 (5) 27 Dec 1996,Fr 专利公布日期<6> Appl.95/7, 302,19, Jun 1995; 专利申请号和申请日期<7> 5pp 专利说明书页数 (8) (Fr) 专利文献的著录格式
化学分子式查询(CA)
CA(美化学文摘)网络版数据库使用说明 一、数据库简介 CA(Chemical Abstracts)由美国化学文摘社(CAS--Chemical Abstracts Service)编辑出版,是涉及学科领域最广、收集文献类型最全、提供检索途径最多、部卷也最为庞大的一部著名的世界性检索工具。CA报道了世界上150多个国家、56种文字出版的9500多种科技期刊、科技报告、会议论文、学位论文、资料汇编、技术报告、新书及视听资料,摘录了世界范围约98%的化学化工文献,所报道的内容几乎涉及化学家感兴趣的所有领域。 SciFinder Scholar数据库为CA(化学文摘)的网络版数据库,收录内容比CA更广泛,功能更强大。利用现代机检技术,进一步提高了化学化工文献的可检性和速检性,更整合了Medline医学数据库、欧洲和美国等50几家专利机构的全文专利资料、以及化学文摘1907年至今的所有内容。它涵盖的学科包括应用化学、化学工程、普通化学、物理、生物学、生命科学、医学、聚合体学、材料学、地质学、食品科学和农学等诸多领域。它可以透过网络直接查看“化学文摘”1907年以来的所有期刊文献和专利摘要;以及八千多万的化学物质记录和CAS注册号。 SciFinder Scholar可检索数据库包括: CAplusSM:包含来自150 多个国家、9000 多种期刊的文献,覆盖1907 年到现在的所有文献以及部分1907 年以前的文献,包括有期刊、专利、会议录、论文、技术报告、书等,涵盖化学、生化、化学工程以及相关学科,还有尚未完全编目收录的最新文献。(目前>2,430 万条参考书目记录,每天更新3000 条以上) MEDLINE?:包含来自70 多个国家、3900 多种期刊的生物医学文献,覆盖1951 到现在的所有文献,以及尚未完全编目收录的最新文献。(目前>1300 万参考书目记录,每周更新4 次) REGISTRYSM: 涵盖从1957 年到现在的特定的化学物质,包括有机化合物、生物序列、配位化合物、聚合物、合金、片状无机物。REGISTRY 包括了在CASM中引用的物质以及特定的注册。例如:管制化学品列表如TSCA 和EINECS 中的注册。(目前>7400 万
研究生写文章必须了解SCI+SSCI+EI+CSCI+CSSCI等
研究生写文章必须了解SCI SSCI EI CSCI CSSCI等 导师给研究生们上课,可能在讲专业知识之前一定要讲一下研究生发论文注意事项:首先就是专业相关的期刊,其次是此期刊被没被SCI,EI,SSCI,CSSCI等收录,还有就一定要“好高骛远”一点,先投高一点的,如果不行逐步降低。 现在,在国际科学界,怎样准确评价基础科学研究效果已引起越来越普遍的关注。而被SCI、SSCI收录的科技论文的多寡则被看作权衡一个国家的基础科学研究水平、科技实力和科技论文水平曲折的重要评价指标。大家可能在本科阶段就可能都略知一二,但是如果投文章时一定要有个详细的了解。 一、自然科学 必须要知道的国外著名的四大索引包括:《科学引文索引》(SCI)、美国的《工程索引》(Ei)、《科技会议录索引》(ISTP)、《科学评论索引》(ISR)。 1.美国科学引文索引(Science Citation Index,SCl) 《SCI》(科学引文索引,Science Citation Index)创刊于1963年,是美国科学情报研究所(ISI,https://www.sodocs.net/doc/5815829770.html,)出版的一部世界著名的期刊文献检索工具。SCI收录全世界出版的数、理、化、农、林、医、生命科学、天文、地理、环境、材料、工程技术等自然科学各学科的核心期刊约3500种;扩展版收录期刊5800余种。ISI通过它严格的选刊标准和评估程序挑选刊源,而且每年略有增减,从而做到其收录的文献能全面覆盖全世界最重要、最有影响力的研究成果。所谓最有影响力的研究成果,是指报道这些成果的文献大量地被其它文献引用。即通过先期的文献被当前文献的引用,来说明文献之间的相关性及先前文献对当前文献的影响力。这使得SCI不仅作为一部文献检索工具使用,而且成为对科研进行评价的一种依据。科研机构被SCI收录的论文总量,反映出整个学术团体的研究水平、尤其是基础研究的水平;个人的论文被SCI收录的数量及被引用次数,反映出个人的研究能力与学术水平。ISI 每年还出版JCR(期刊引用报告,Journal Citation Reports)。JCR对包括SCI收录的3500种期刊在内的4700种期刊之间的引用和被引用数据进行统计、运算,并针对每种期刊定义了影响因子(Impact Factor)等指数加以报道。一种期刊的影响因子,指该刊前二年发表的文献在当年的平均被引用次数。一种刊物的影响因子越高,其刊载的文献被引用率越高,说明这些文献报道的研究成果影响力大,反映该刊物的学术水平高。论文作者可根据期刊的影响因子排名决定投稿方向。 《SCI》先后采用过我国期刊17种,1982年多达13种,以后逐年下降,1994年和1995年仅有6种,1995年《SCI》所收录的期刊中,我国期刊只占0.17%。l997年以来,《SCI》收录我国期刊的数量有所增加,1999年《SCI》收录我国期刊共13种,它们是《中国科学A 辑》、《中国科学B辑》,《中国科学C辑》,《中国科学D辑》,《中国科学E辑》,《科学通报》,《中国物理快报》,《理论物理通讯》,《化学学报》,《中华医学杂志》,《中国药理学报》,《高等学校化学学报》和《力学学报》。 《SCI》收录过但目前没有被收录的(不包括SCI扩大版收录的)我国期刊有:《地质学报》、《地球物理学报》、《地质科学》、《动物学报》、《昆虫学报》、《古脊椎动物与古人类学报》、《科学研究报告》、《中国物理》和《数学年刊B辑》。
21美国化学文摘的检索
19.1 美国化学文摘的检索 网上权威站点:https://www.sodocs.net/doc/5815829770.html,/PRINTED/caresources.html 19.1.1 概况: 美国化学文摘由美国化学学会(CAS)的化学文摘服务处(Chemical Abstraccts Service,简称CAS)于1907年创刊的化学化工专业性文摘刊物。德国《化学文摘》1830年创刊,经140年后1969年停刊并入美国化学文摘。美国化学文摘成为世界上最权威的化学化工文献检索工具,正如他在扉页中所称是CA是“打开世界化学文献宝库的钥匙”。CA的文摘客观详细地报道化学工程纯技术性的文献,不加任何的评论。它主要包括的内容有: ?原文献所报道的研究工作的目的和范围 ?新的化学反应,化合物,材料,工艺,操作,设备,性质和理论 ?已有知识的新应用 ?研究结果和作者的判断和结论 19.1.1.1 查CA可获得什么?收集文献范围 CA系统﹑全面地收录了占世界化学化工方面百分之九十八的文献,其中70%的文献来自美国以外的国家和地区。同时收录大量生物学、医学、药学、卫生学等相关专业的文献。涉及到生物医学、冶金、轻工、物理、能源、天体宇宙等各领域的文献CA收录有150多个国家的56种文字出版的期16000余种2 6个国家和两个国际组织的会议文献5%﹑专利献16%﹑学位论文2%、图书1%、科技报告2%﹑期刊74%、专著﹑会议录﹑论文集﹑学位论文和图书(包括视听资料)。CA每周报道10000条左右文摘,而且每年的文摘报道量也在逐年增加。周刊,每年2卷,每卷26期。 19.1.1.2 为什么要用印刷版CA? 现在已有计算机查询用光盘,仍然要了解印刷版CA的使用方法,理由: 1.光盘的资源有限:可以回溯的时期有限。 2.光盘数据库建立在印刷版的基础上。光盘上用的索引,字段与印刷版的索引相应。 3.光盘查询无法浏览摘要,而印刷版可以按CA的类别浏览内容。 19.1.1.3 浏览印刷版的CA的好处和技巧 供参考(以下说明参考了CAS站点的指导): 1)浏览CA 提高你的创造性 浏览CA提高对一个主题的理解,提高碰见大量看起来无关但在形成新的结论时重要的信息的机会2)尝试磨练直觉 创造性地查询CA的技巧:随机翻阅CA的某卷,翻动书页;在不相关的部分,注意你的眼睛抓住的不相关的词或结构;这也许时新思想的萌芽,或是以前未知的但高度相关的信息入口点 3)寻找与众不同的连接