Chart of Accounts - Fundamental Accounting Principles (20th Edition)
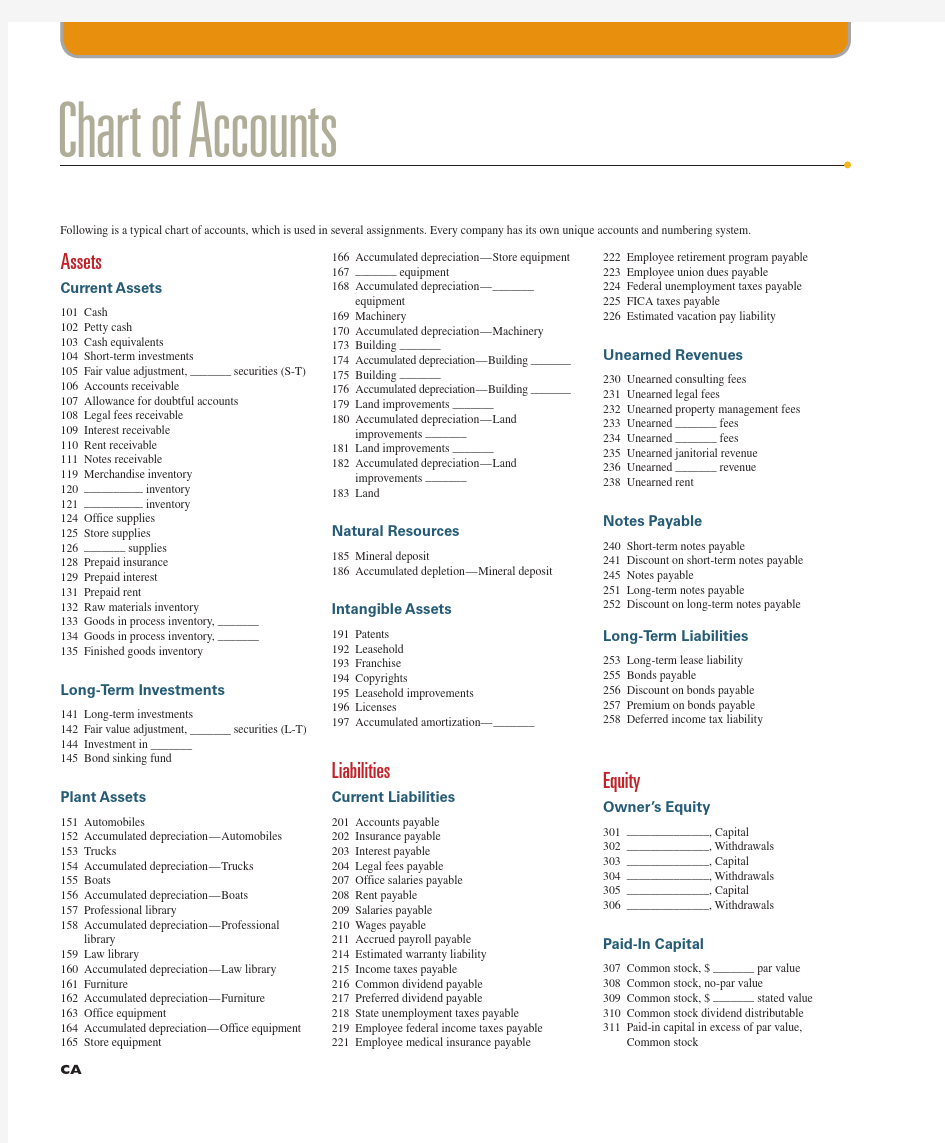
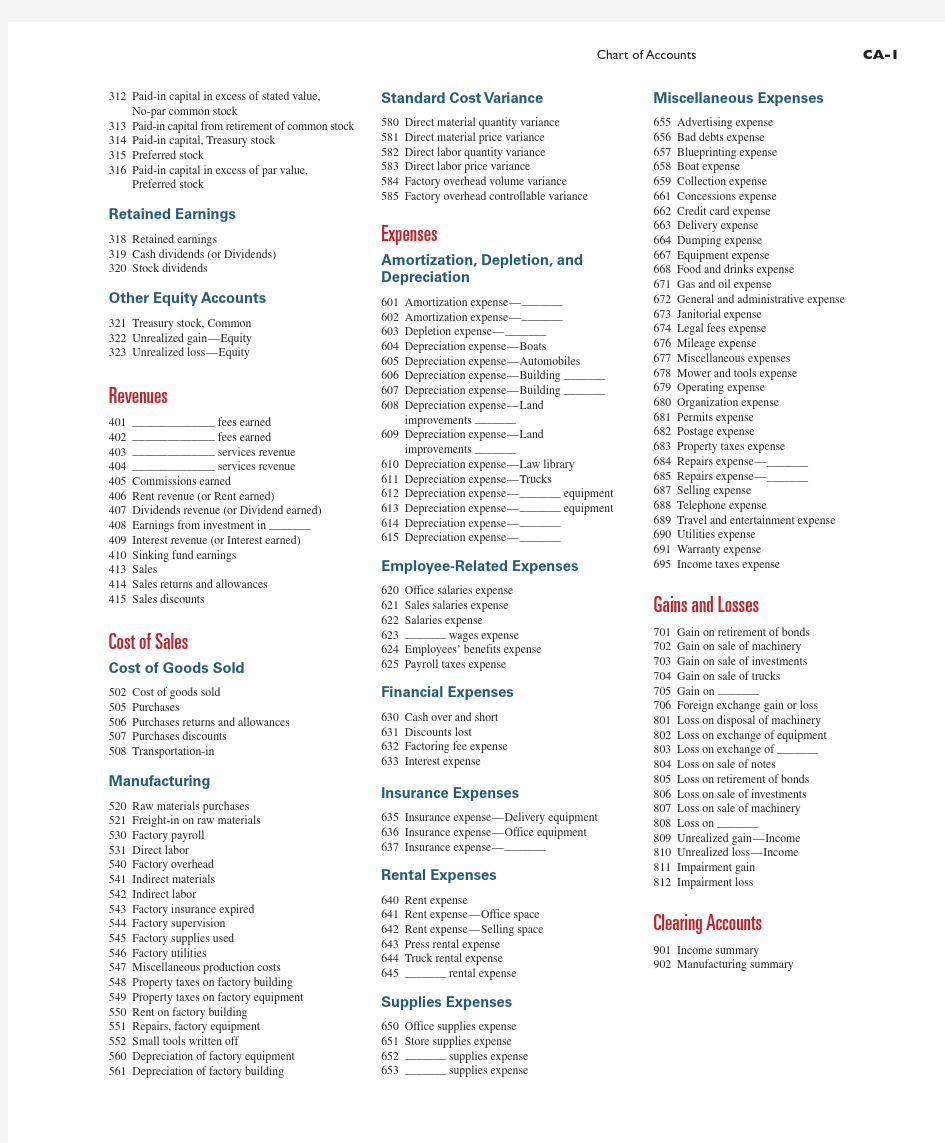
Following is a typical chart of accounts, which is used in several assignments. Every company has its own unique accounts and numbering system.
Assets
Current Assets
101 C ash
102 P etty cash
103 C ash equivalents
104 S hort-term investments
105 F air value adjustment, _______ securities (S-T) 106 A ccounts receivable
107 A llowance for doubtful accounts
108 L egal fees receivable
109 I nterest receivable
110 R ent receivable
111 N otes receivable
119 M erchandise inventory
120 __________ inventory
121 __________ inventory
124 O ffice supplies
125 S tore supplies
126 _______ supplies
128 P repaid insurance
129 P repaid interest
131 P repaid rent
132 R aw materials inventory
133 G oods in process inventory, _______
134 G oods in process inventory, _______
135 F inished goods inventory
Long-T erm Investments
141 L ong-term investments
142 F air value adjustment, _______ securities (L-T) 144 I nvestment in _______
145 B ond sinking fund
Plant Assets
151 A utomobiles
152 A ccumulated depreciation—Automobiles 153 T rucks
154 A ccumulated depreciation—Trucks
155 B oats
156 A ccumulated depreciation—Boats
157 P rofessional library
158 A ccumulated depreciation—Professional l ibrary
159 L aw library
160 A ccumulated depreciation—Law library
161 F urniture
162 A ccumulated depreciation—Furniture
163 O ffice equipment
164 A ccumulated depreciation—Office equipment 165 S tore equipment 166 A ccumulated depreciation—Store equipment
167 _______ equipment
168 A ccumulated depreciation—_______
equipment
169 M achinery
170 A ccumulated depreciation—Machinery
173 B uilding _______
174 A ccumulated depreciation—Building _______
175 B uilding _______
176 A ccumulated depreciation—Building _______
179 L and improvements _______
180 A ccumulated depreciation—Land
i mprovements _______
181 L and improvements _______
182 A ccumulated depreciation—Land
i mprovements _______
183 L and
Natural Resources
185 M ineral deposit
186 A ccumulated depletion—Mineral deposit
Intangible Assets
191 P atents
192 L easehold
193 F ranchise
194 C opyrights
195 L easehold improvements
196 L icenses
197 A ccumulated amortization—_______
Liabilities
Current Liabilities
201 A ccounts payable
202 I nsurance payable
203 I nterest payable
204 L egal fees payable
207 O ffice salaries payable
208 R ent payable
209 S alaries payable
210 W ages payable
211 A ccrued payroll payable
214 E stimated warranty liability
215 I ncome taxes payable
216 C ommon dividend payable
217 P referred dividend payable
218 S tate unemployment taxes payable
219 E mployee federal income taxes payable
221 E mployee medical insurance payable
222 E mployee retirement program payable
223 E mployee union dues payable
224 F ederal unemployment taxes payable
225 F ICA taxes payable
226 E stimated vacation pay liability
Unearned Revenues
230 U nearned consulting fees
231 U nearned legal fees
232 U nearned property management fees
233 U nearned _______ fees
234 U nearned _______ fees
235 U nearned janitorial revenue
236 U nearned _______ revenue
238 U nearned rent
Notes Payable
240 S hort-term notes payable
241 D iscount on short-term notes payable
245 N otes payable
251 L ong-term notes payable
252 D iscount on long-term notes payable
Long-T erm Liabilities
253 L ong-term lease liability
255 B onds payable
256 D iscount on bonds payable
257 P remium on bonds payable
258 D eferred income tax liability
Equity
Owner’s Equity
301 ______________, Capital
302 ______________, Withdrawals
303 ______________, Capital
304 ______________, Withdrawals
305 ______________, Capital
306 ______________, Withdrawals
Paid-In Capital
307 C ommon stock, $ _______ par value
308 C ommon stock, no-par value
309 C ommon stock, $ _______ stated value
310 C ommon stock dividend distributable
311 P aid-in capital in excess of par value,
Common stock
Chart of A ccounts
CA
Chart of Accounts CA-1
312 P aid-in capital in excess of stated value, No-par common stock
313 P aid-in capital from retirement of c ommon stock 314 P aid-in capital, Treasury stock
315 P referred stock
316 P aid-in capital in excess of par value,
Preferred stock
Retained Earnings
318 R etained earnings
319 C ash dividends (or Dividends)
320 S tock dividends
Other Equity Accounts
321 T reasury stock, Common
322 U nrealized gain—Equity
323 U nrealized loss—Equity
Revenues
401 ______________ fees earned
402 ______________ fees earned
403 ______________ services revenue
404 ______________ services revenue
405 C ommissions earned
406 R ent revenue (or Rent earned)
407 D ividends revenue (or Dividend earned)
408 E arnings from investment in _______
409 I nterest revenue (or Interest earned)
410 S inking fund earnings
413 S ales
414 S ales returns and allowances
415 S ales discounts
Cost of Sales
Cost of Goods Sold
502 C ost of goods sold
505 P urchases
506 P urchases returns and allowances
507 P urchases discounts
508 T ransportation-in
Manufacturing
520 R aw materials purchases
521 F reight-in on raw materials
530 F actory payroll
531 D irect labor
540 F actory overhead
541 I ndirect materials
542 I ndirect labor
543 F actory insurance expired
544 F actory supervision
545 F actory supplies used
546 F actory utilities
547 M iscellaneous production costs
548 P roperty taxes on factory building
549 P roperty taxes on factory equipment
550 R ent on factory building
551 R epairs, factory equipment
552 S mall tools written off
560 D epreciation of factory equipment
561 D epreciation of factory building Standard Cost Variance
580 D irect material quantity variance
581 D irect material price variance
582 D irect labor quantity variance
583 D irect labor price variance
584 F actory overhead volume variance
585 F actory overhead controllable variance
Expenses
Amortization, Depletion, and
Depreciation
601 A mortization expense—_______
602 A mortization expense—_______
603 D epletion expense—_______
604 D epreciation expense—Boats
605 D epreciation expense—Automobiles
606 D epreciation expense—Building _______
607 D epreciation expense—Building _______
608 D epreciation expense—Land
improvements _______
609 D epreciation expense—Land
improvements _______
610 D epreciation expense—Law library
611 D epreciation expense—Trucks
612 D epreciation expense—_______ equipment
613 D epreciation expense—_______ equipment
614 D epreciation expense—_______
615 D epreciation expense—_______
Employee-Related Expenses
620 O ffice salaries expense
621 S ales salaries expense
622 S alaries expense
623 _______ wages expense
624 E mployees’ benefits expense
625 P ayroll taxes expense
Financial Expenses
630 C ash over and short
631 D iscounts lost
632 F actoring fee expense
633 I nterest expense
Insurance Expenses
635 I nsurance expense—Delivery equipment
636 I nsurance expense—Office equipment
637 I nsurance expense—_______
Rental Expenses
640 R ent expense
641 R ent expense—Office space
642 R ent expense—Selling space
643 P ress rental expense
644 T ruck rental expense
645 _______ rental expense
Supplies Expenses
650 O ffice supplies expense
651 S tore supplies expense
652 _______ supplies expense
653 _______ supplies expense
Miscellaneous Expenses
655 A dvertising expense
656 B ad debts expense
657 B lueprinting expense
658 B oat expense
659 C ollection expense
661 C oncessions expense
662 C redit card expense
663 D elivery expense
664 D umping expense
667 E quipment expense
668 F ood and drinks expense
671 G as and oil expense
672 G eneral and administrative expense
673 J anitorial expense
674 L egal fees expense
676 M ileage expense
677 M iscellaneous expenses
678 M ower and tools expense
679 O perating expense
680 O rganization expense
681 P ermits expense
682 P ostage expense
683 P roperty taxes expense
684 R epairs expense—_______
685 R epairs expense—_______
687 S elling expense
688 T elephone expense
689 T ravel and entertainment expense
690 U tilities expense
691 W arranty expense
695 I ncome taxes expense
Gains and Losses
701 G ain on retirement of bonds
702 G ain on sale of machinery
703 G ain on sale of investments
704 G ain on sale of trucks
705 G ain on _______
706 F oreign exchange gain or loss
801 L oss on disposal of machinery
802 L oss on exchange of equipment
803 L oss on exchange of _______
804 L oss on sale of notes
805 L oss on retirement of bonds
806 L oss on sale of investments
807 L oss on sale of machinery
808 L oss on _______
809 U nrealized gain—Income
810 U nrealized loss—Income
811 Impairment gain
812 Impairment loss
Clearing Accounts
901 I ncome summary
902 M anufacturing
summary
This page intentionally left blank
① Cost Types Variable costs: Total cost changes in proportion to volume of activity
Fixed costs: Total cost does not change in proportion to volume of activity Mixed costs:
Cost consists of both a variable and a fixed element
② Cost Sources
Direct materials: Raw materials costs directly linked to finished product Direct labor: Employee costs directly linked to finished product Overhead: Costs indirectly linked to finished product ③ Costing Systems
Job order costing: Costs assigned to each unique unit or batch of units
Process costing: Costs assigned to similar products that are mass-produced in a continuous manner ④ Costing Ratios
Contribution margin ratio 5 (Net sales 2 Variable costs)y Net sales
Predetermined overhead rate 5 Estimated overhead costs y Estimated activity base Break-even point in units 5 Total fixed costs y Contribution margin per unit ⑤ Planning and Control Metrics
Cost variance 5 Actual cost 2 Standard (budgeted) cost
Sales (revenue) variance 5 Actual sales 2 Standard (budgeted) sales
⑥ Capital Budgeting
Payback period 5 Time expected to recover investment cost
Accounting rate of return 5 Expected annual net income y Average annual investment Net present value (NPV) 5 Present value of future cash flows 2 Investment cost NPV rule: 1. Compute net present value (NPV in $) 2. If NPV $ 0, then accept project; If NPV , 0, then reject project Internal rate 1. Compute internal rate of return (IRR in %) of return rule: 2. I f IRR $ hurdle rate, accept project; If IRR , hurdle rate, reject project ⑦ Costing Terminology Relevant range: Organization’s normal range of operating activity. Direct cost: Cost incurred for the benefit of one cost object. Indirect cost: Cost incurred for the benefit of more than one cost object. Product cost: Cost that is necessary and integral to finished products. Period cost: Cost identified more with a time period than with finished products. Overhead cost: Cost not separately or directly traceable to a cost object. Relevant cost: Cost that is pertinent to a decision.
Opportunity cost: Benefit lost by choosing an action from two or more alternatives. Sunk cost: Cost already incurred that cannot be avoided or changed. Standard cost: Cost computed using standard price and standard quantity. Budget: Formal statement of an organization’s future plans. Break-even point: Sales level at which an organization earns zero profit.
Incremental cost: Cost incurred only if the organization undertakes a certain action. Transfer price:
Price on transactions between divisions within a company.⑧ Standard Cost Variances 5
Materials price variance 1 Materials
quantity
variance
5
Labor
(rate)variance 1 Labor efficiency (quantity)variance
5 Overhead
controllable variance 1 Fixed overhead volume
variance
Overhead controllable 5
A ctual total 2 Applied total overhead
variance overhead from flexible budget Fixed overhead volume 5 Budgeted fixed 2 Applied fixed variance
overhead overhead
Variable overhead variance 5 V ariable overhead 1 Variable overhead spending variance efficiency variance Fixed overhead variance 5 F ixed overhead 1 Fixed overhead variance volume variance
5 [AQ 3 AP] 2 [AQ 3 SP]5 [AQ 3 SP] 2 [SQ 3 SP]5 [AH 3 AR] 2 [AH 3 SR]
[AH 3 SR] 2 [SH 3 SR]Variable overhead spending variance 5 [AH 3 AVR] 2 [AH 3 SVR]
Variable overhead efficiency variance 5 [AH 3 SVR] 2 [SH 3 SVR]
Fixed overhead spending variance
5 Actual fixed overhead 2 Budgeted fixed overhead
where AQ is actual q _uantity of materials; AP is actual p _rice of materials; AH is actual hours of labor; AR is actual rate of wages; AVR is actual variable rate of overhead; SQ is standard q _uan-tity of materials; SP is standard p _rice of materials; SH is standard hours of labor; SR is standard rate of wages; SVR is standard variable rate of overhead.[AS 3 AP] 2 [AS 3 BP][AS 3 BP] 2 [BS 3 BP]
where AS 5 actual sales units; AP 5 actual sales price; BP 5 budgeted sales price; ?
????
5Total overhead
variance Net sales (revenues) . . . . . . . . . . . . . . . . . . . . . . . . . . . . . . $ #
Total variable costs . . . . . . . . . . . . . . . . . . . . . . . . . . . . . . . #Contribution margin . . . . . . . . . . . . . . . . . . . . . . . . . . . . . . #Total fixed costs . . . . . . . . . . . . . . . . . . . . . . . . . . . . . . . . . #Net income . . . . . . . . . . . . . . . . . . . . . . . . . . . . . . . . . . . . .
$ #
Direct materials
Raw materials inventory, Beginning . . . . . . . . . . . . . . . .
$
#
Raw materials purchases . . . . . . . . . . . . . . . . . . . . . . . . . # Raw materials available for use . . . . . . . . . . . . . . . . . . . # Raw materials inventory, Ending . . . . . . . . . . . . . . . . . . (#) Direct materials used . . . . . . . . . . . . . . . . . . . . . . . . . . . #Direct labor . . . . . . . . . . . . . . . . . . . . . . . . . . . . . . . . . . . . . #Overhead costs
Total overhead costs . . . . . . . . . . . . . . . . . . . . . . . . . . . #Total manufacturing costs . . . . . . . . . . . . . . . . . . . . . . . . . #Add goods in process inventory, Beginning . . . . . . . . . . . #Total cost of goods in process . . . . . . . . . . . . . . . . . . . . . #Deduct goods in process inventory, Ending . . . . . . . . . . . (#)Cost of goods manufactured . . . . . . . . . . . . . . . . . . . . . . .
$ #
Sales (revenues) . . . . . . . . . . . . . . . . . . . . . . . . . . . . . . .
$ # $ #
Variable costs
Examples: Direct materials, Direct labor, . . . . . . . . . Other variable costs . . . . . . . . . . . . . . . . . . . . . . . # # Total variable costs . . . . . . . . . . . . . . . . . . . . . . . . . . # #Contribution margin . . . . . . . . . . . . . . . . . . . . . . . . . . . $ #
#Fixed costs
Examples: Depreciation, Manager . . . . . . . . . . . . . . . $ #
# salaries, Administrative salaries . . . . . . . . . . . . . . . # # Total fixed costs . . . . . . . . . . . . . . . . . . . . . . . . . . . . . $ #
#Income from operations . . . . . . . . . . . . . . . . . . . . . . . .
Sales: In units . . . . . . . . . . . . . . . . . . . . . . . . # # In dollars . . . . . . . . . . . . . . . . . . . . . . . $ #
$ #
$ # F or U
Cost of sales Direct costs . . . . . . . . . . . . . . . . . . . . . . . # # #
F or U Indirect costs . . . . . . . . . . . . . . . . . . . . . .
# # # F or U Selling expenses
Examples: Commissions, . . . . . . . . . . . . . # # # F or U Shipping expenses . . . . . . . . . . . . . . . . . # # # F or U General and administrative expenses Examples: Administrative salaries . . . . . . # # # F or U Total expenses . . . . . . . . . . . . . . . . . . . . . . . $ # $ # $ # F or U Income from operations . . . . . . . . . . . . . . .
$ #
$ #
$ # F or U
?
F 5 Favorable variance; U 5 Unfavorable variance.
Operating Budgets
Capital Expenditures
Budget
Financial Budgets
MANAGERIAL ANALYSES AND REPORTS
FUNDAMENTALS
① Accounting Equation
Owner’s Owner’s 1 Indicates normal balance.
*Comparable corporate accounts are Common Stock (Paid-In Capital) and Dividends.
② Accounting Cycle
⑦ Inventory Costing Methods ? Specific Identification ? Weighted-Average
? First-In, First-Out (FIFO) ? Last-In, First-Out (LIFO)
⑧ Depreciation and Depletion Straight-Line: Cost 2Salvage value Useful life in periods 3 Periods expired Units-of-Production:
Cost 2Salvage value Useful life in units
3 Units produced
Declining-Balance: Rate* 3 Beginning-of-period book value
*Rate is often double the straight-line rate, or 2 3 (1y Useful life)
Depletion:
Cost 2Salvage value Total capacity in units
3 Units extracted
⑨ Interest Computation Interest 5 Principal (face) 3 Rate 3 Time ⑩ Accounting for Investment Securities
④ 4-Step Closing Process
1. Transfer revenue and gain account balances to Income Summary.
2. Transfer expense and loss account balances to Income Summary.
3. Transfer Income Summary balance to Owner’s Capital.
4. Transfer Withdrawals balance to Owner’s Capital.??????????
??????????????????????
?????
↑
ANALYSES
① Liquidity and Efficiency Current ratio 5
Current assets Current liabilities
p. 148Working capital 5 Current assets 2 Current liabilities p. 697Acid-test ratio 5
Cash 1Short-term investments 1Current receivables
Current liabilities
p. 196Accounts receivable turnover 5Net sales
Average accounts receivable, net
p. 375Credit risk ratio 5
Allowance for doubtful accounts
Accounts receivable, net p. 375Inventory turnover 5
Cost of goods sold Average inventory
p. 241
Days’ sales uncollected 5Accounts receivable, net
Net sales 3365*
p. 335Days’ sales in inventory 5
Ending inventory Cost of goods sold
3365*
p. 241Total asset turnover
5
Net sales
Average total assets
p. 413Plant asset useful life 5
Plant asset cost
Depreciation expense p. 413Plant asset age 5
Accumulated depreciation Depreciation expense
p. 413Days’ cash expense coverage 5
Cash and cash equivalents Average daily cash expenses
p. 322
*360 days is also commonly used.
② Solvency Debt ratio 5
Total liabilities Total assets
Equity ratio 5
Total equity Total assets
pp. 69 & 701
Debt-to-equity 5
Total liabilities
Total equity p. 567Times interest earned 5
Income before interest expense and income taxes
Interest expense
p. 450Cash coverage of growth 5 Cash flow from operations Cash outflow for plant assets
p. 651Cash coverage of debt 5
Cash flow from operations Total noncurrent liabilities
p. 646
③ Profitability Profit margin ratio 5
Net income
Net sales 109Gross margin ratio 5
Net sales 2Cost of goods sold
Net sales
p. 196Return on total assets 5
Net income Average total assets
p. 225Profit margin ratio 3Total asset turnover
p. 703Return on common stockholders’ equity 5Net income 2Preferred dividends Average common stockholders’ equity
p. 703Book value per common share 5Stockholders’ equity applicable to common shares
Number of common shares outstanding
p. 528Basic earnings per share 5Net income 2Preferred dividends
Weighted-average common shares outstanding p. 527Cash flow on total assets 5Cash flow from operations Average total assets
p. 650Payout ratio 5
Cash dividends declared on common stock
Net income
p. 528
④ Market
Price-earnings ratio 5Market value (price) per share
Earnings per share
p. 527Dividend yield 5
Annual cash dividends per share
Market price per share
p. 528
Residual income 5 Net income 2 Target net income
⑤ Accounting Concepts
Characteristics Assumptions Principles Constraints Relevance Business entity Historical cost
Cost-benefit Reliability Going concern Revenue recognition Materiality
Comparability Monetary unit
Expense recognition Industry practice Consistency Periodicity Full disclosure
Conservatism
⑥ Ownership of Inventory
Ownership Transfers
Transportation Costs
When Goods Passed To
Paid By
FOB Shipping Point. . . . . . . . . . . Carrier Buyer FOB Destination . . . . . . . . . . . . .
Buyer
Seller
Type Adjusting Entry Prepaid Expenses . . . . . . . . . . . . . . . . . . . . . . . . . . . . . . . . . . Dr. Expense Cr. Asset*Unearned Revenues . . . . . . . . . . . . . . . . . . . . . . . . . . . . . . . . Dr. Liability Cr. Revenue Accrued Expenses . . . . . . . . . . . . . . . . . . . . . . . . . . . . . . . . . Dr. Expense Cr. Liability Accrued Revenues . . . . . . . . . . . . . . . . . . . . . . . . . . . . . . . . .
Dr. Asset Cr. Revenue
*For depreciation, credit Accumulated Depreciation (contra asset).
③ Adjustments and Entries
2.Journalize
10.Reverse
(Optional)
1.
Analyze transactions
Accounting
Cycle
3.Post
4.
Prepare unadjusted
trial balance
5.Adjust
6.
Prepare adjusted trial balance
9.
Prepare post-closing trial balance
7.
Prepare statements
8.Close Classification* Accounting Short-Term Investment in Securities Held-to-maturity (debt) securities . . . . . . . . . . . . Cost (without any discount or premium amortization)
Trading (debt and equity) securities. . . . . . . . . . . Fair value (with fair value adjustment to income)
Available-for-sale (debt and equity) securities. . . Fair value (with fair value adjustment to equity)Long-Term Investment in Securities Held-to-maturity (debt) securities . . . . . . . . . . . . Cost (with any discount or premium amortization)
Available-for-sale (debt and equity) securities. . . Fair value (with fair value adjustment to equity) Equity securities with significant influence. . . . . . Equity method
Equity securities with controlling influence. . . . .
Equity method (with consolidation)
FINANCIAL REPORTS
Owner, Capital, beginning . . . . . . . . . . . . . . . . .$ #
Add: Investments by owner. . . . . . . . . . . . . . . .$ #
Net income . . . . . . . . . . . . . . . . . . . . . . . .# #
#
Less: Withdrawals by owner. . . . . . . . . . . . . . .#
Owner, Capital, ending . . . . . . . . . . . . . . . . . . .$ #
* For a corporation, statement of owner’s equity becomes statement of retained earnings with these changes: “owner,
capital” is retained earnings; “investments by owner” is deleted; and “withdrawals by owner” is dividends.
Examples: Cash, Cash equivalents, Short-term investments,
Accounts receivable, Current portion of notes . . . . . . . . . . . . . . . . . . . $ #
receivable, Inventory, Prepaid expenses . . . . . . . . . . . . . . . . . . . . . . #
Total current assets . . . . . . . . . . . . . . . . . . . . . . . . . . . . . . . . . . . . . . . . $ #
Long-term investments
Examples: Investment in stock, Investment in bonds, . . . . . . . . . . . . . . #
Land for expansion . . . . . . . . . . . . . . . . . . . . . . . . . . . . . . . . . . . . . . . #
Total long-term investments . . . . . . . . . . . . . . . . . . . . . . . . . . . . . . . . . #
Plant assets
Examples: Equipment, Machinery, Buildings, Land . . . . . . . . . . . . . . . . . #
Total plant assets, net of depreciation . . . . . . . . . . . . . . . . . . . . . . . . . #
Intangible assets
Examples: Patent, Trademark, Copyright, License, Goodwill . . . . . . . . #
Total intangible assets, net of amortization . . . . . . . . . . . . . . . . . . . . . . #
Total assets . . . . . . . . . . . . . . . . . . . . . . . . . . . . . . . . . . . . . . . . . . . . . . . . . $ #
LIABILITIES AND EQUITY
Current liabilities
Examples: Accounts payable, Wages payable, Salaries. . . . . . . . . . . . . . $ #
payable, Current notes payable, Taxes payable, . . . . . . . . . . . . . . . . #
Interest payable, Unearned revenues. . . . . . . . . . . . . . . . . . . . . . . . . #
Total current liabilities . . . . . . . . . . . . . . . . . . . . . . . . . . . . . . . . . . . . . . $ #
Long-term liabilities
Examples: Notes payable, Bonds payable, Lease liability . . . . . . . . . . . . #
Total long-term liabilities. . . . . . . . . . . . . . . . . . . . . . . . . . . . . . . . . . . . . #
Total liabilities . . . . . . . . . . . . . . . . . . . . . . . . . . . . . . . . . . . . . . . . . . . . . . . #
Equity*
Owner, Capital . . . . . . . . . . . . . . . . . . . . . . . . . . . . . . . . . . . . . . . . . . . . #
Total liabilities and equity . . . . . . . . . . . . . . . . . . . . . . . . . . . . . . . . . . . . . . $ #
* A corporation’s equity consists of: Paid-In Capital and Retained Earnings (less any treasury stock).
Net sales (revenues) . . . . . . . . . . . . . . . . . . . . . . . . . . . . . . . . . . . . . . . . . $ #
Cost of goods sold (cost of sales) . . . . . . . . . . . . . . . . . . . . . . . . . . . . . . #
Gross margin (gross profit) . . . . . . . . . . . . . . . . . . . . . . . . . . . . . . . . . . . . #
Operating expenses
Examples: Depreciation, salaries, . . . . . . . . . . . . . . . . . . . . . . . . . . . . . $ #
wages, rent, utilities, interest, . . . . . . . . . . . . . . . . . . . . . . . . . . . . . . #
amortization, advertising, taxes . . . . . . . . . . . . . . . . . . . . . . . . . . . . . #
Total operating expenses . . . . . . . . . . . . . . . . . . . . . . . . . . . . . . . . . . . . . . #
Nonoperating gains and losses. . . . . . . . . . . . . . . . . . . . . . . . . . . . . . . . . . #
Net income (net profit or earnings) . . . . . . . . . . . . . . . . . . . . . . . . . . . . . $ #
* A typical chart of accounts is at the end of the book and classifies all accounts by financial statement categories.
?Indirect Method: Cash Flows from Operating Activities
Cash flows from operating activities
Net income . . . . . . . . . . . . . . . . . . . . . . . . . . . . . . . . . . . . . . . . . . . . . . . . . $
#
Add: Decreases in noncash current assets . . . . . . . . . . . . . . . . . . . . . . . . $ #
Increases in current liabilities . . . . . . . . . . . . . . . . . . . . . . . . . . . . . . #
Expenses with no cash outflows (examples: depreciation,
and amortization of both intangibles and bond discounts) . . . . . #
Nonoperating losses (examples: losses from asset sales
and from debt retirements) . . . . . . . . . . . . . . . . . . . . . . . . . . . . . # #
Less: Increases in noncash current assets . . . . . . . . . . . . . . . . . . . . . . . . . #
Decreases in current liabilities . . . . . . . . . . . . . . . . . . . . . . . . . . . . . #
Revenues with no cash inflows (examples:
amortization of bond premiums) . . . . . . . . . . . . . . . . . . . . . . . . . #
Nonoperating gains (examples: gains from asset sales
and from debt retirements) . . . . . . . . . . . . . . . . . . . . . . . . . . . . .
# #
Net cash provided (used) by operating activities . . . . . . . . . . . . . . . . . . . # # # # # #
. . . . . . . . . . . . . . . . . .
Cash flows from operating activities
[Prepared using the indirect (see below)? or direct method]
Net cash provided (used) by operating activities. . . . . . . . . . . . . . . . . . . . . . . . . . . .$ # Cash flows from investing activities
[List of individual investing inflows and outflows]
Net cash provided (used) by investing activities . . . . . . . . . . . . . . . . . . . . . . . . . . . .# Cash flows from financing activities
[List of individual financing inflows and outflows]
Net cash provided (used) by financing activities . . . . . . . . . . . . . . . . . . . . . . . . . . . .# Net increase (decrease) in cash . . . . . . . . . . . . . . . . . . . . . . . . . . . . . . . . . . . . . . . . . . .$ # Cash (and equivalents) balance at beginning of period . . . . . . . . . . . . . . . . . . . . . . . . .# Cash (and equivalents) balance at end of period. . . . . . . . . . . . . . . . . . . . . . . . . . . . . .$ # Attach separate schedule or note disclosure of “Noncash investing and financing transactions.”
Discount Bond Amortization (Straight-Line) Table?
Semiannual Period-End Unamortized Bond Discount* Bond Carrying Value** Bond life-start . . . . . . . . . . . . . .$ # $ #
. . . . . . . . . . . . . . . . . . . . . . . . . .
. . . . . . . . . . . . . . . . . . . . . . . . . .
Bond life-end . . . . . . . . . . . . . . .0 par
?B ond carrying value is adjusted to par and its amortized discount to zero over the bond life (note: unamortized bond discount plus carrying value equals par).
* Equals total bond discount less its accumulated amortization.
** Equals bond par value less its unamortized bond discount.
.
.
.
.
.
.
.
.
.
.
Premium Bond Amortization (Straight-Line) Table?
Semiannual Period-End Unamortized Bond Premium* Bond Carrying Value** Bond life-start . . . . . . . . . . . . . .$ # $ #
. . . . . . . . . . . . . . . . . . . . . . . . . .
. . . . . . . . . . . . . . . . . . . . . . . . . .
Bond life-end . . . . . . . . . . . . . . .0 par
?B ond carrying value is adjusted to par and its amortized premium to zero over the bond life (note: carrying value less unamortized bond premium equals par).
* Equals total bond premium less its accumulated amortization.
** Equals bond par value plus its unamortized bond premium.
.
.
.
.
.
.
.
.
.
.
. . . . . .
. . . . . .
. . . . . .
A Par value multiplied by the semiannual contract rate.
B Prior period’s carrying value multiplied by the semiannual market rate.
C The difference between interest paid and bond interest expense.
D Prior period’s unamortized discount or premium less the current period’s discount or premium amortization.
E Par value less unamortized discount or plus unamortized premium.
Book balance . . . . . . . . . . . . . . . . . . . .$#
Add: Unrecorded bank credit
memoranda . . . . . . . . . . . . . .#
Book errors understating
the balance. . . . . . . . . . . . . . .#
Less: Unrecorded bank debit
memoranda . . . . . . . . . . . . . .#
Book errors overstating
the balance. . . . . . . . . . . . . . .$# Bank statement balance. . . . . . . . . . .$#
Add: Unrecorded deposits. . . . . . . .#
Bank errors understating
the balance . . . . . . . . . . . . .#
Less: Outstanding checks . . . . . . . . .#
Bank errors overstating
the balance . . . . . . . . . . . . .#
Adjusted bank balance. . . . . . . . .
SELECTED TRANSACTIONS AND RELATIONS
① Merchandising Transactions Summary
② Merchandising Cash Flows
⑥ Stock Transactions Summary
Cash. . . . . . . . . . . . . Decrease — —Common Stock . . . . — Increase —Retained Earnings . .
Decrease
Decrease
—
③ Credit Terms and Amounts
Due minus discount*
*Discount refers to a purchase discount for a buyer and a sales discount for a seller.
Discount* period Credit period
Date of Credit Terms
for Doubtful
Accounts Receivable for Doubtful Accounts Receivable (by Age)
(by Age)
=×
*The term Consolidated often precedes or follows these statement titles to reflect
the combination of different entities,such as a parent company and its subsidiaries.?
Balance Sheet
Statement of Financial Position Statement of Financial Condition Income Statement
Statement of Income Operating Statement Statement of Operations
Statement of Operating Activity Earnings Statement Statement of Earnings
Profit and Loss (P&L) Statement
Statement of Statement of Cash Flow Cash Flows Cash Flows Statement
Statement of Changes in Cash Position Statement of Changes in Financial Position Statement of Statement of Changes in Owner’s Equity Owner’s Equity Statement of Changes in Owner’s Capital Statement of Shareholders’ Equity ?
Statement of Changes in Shareholders’ Equity ?Statement of Stockholders’ Equity and Comprehensive Income ?
Statement of Changes in Capital Accounts ?
The same financial statement sometimes receives different titles.Following are some of the more common aliases.*
⑧ A Rose by Any Other Name
A Rose by Any Other Name
* T he term Consolidated often precedes or follows these statement titles to reflect
the combination of different entities, such as a parent company and its subsidiaries.?
For corporations only.
We thank Dr. Louella Moore from Arkansas State University for suggesting this listing.
The same financial statement sometimes receives different titles. Following are some of the more common aliases.*
Balance Sheet Statement of Financial Position Statement of Financial Condition
Income Statement Statement of Income
Operating Statement Statement of Operations Statement of Operating Activity
Earnings Statement Statement of Earnings Profit and Loss (P&L) Statement Statement of Statement of Cash Flow Cash Flows Cash Flows Statement
Statement of Changes in Cash Position
Statement of Changes in Financial Position Statement of Statement of Changes in Owner’s Equity Owner’s Equity Statement of Changes in Owner’s Capital Statement of Shareholders’ Equity ? S tatement of Changes in Shareholders’ Equity ? S tatement of Stockholders’ Equity and Comprehensive Income ?
Statement of Changes in Capital Accounts
?
mschart控件使用详解
一.数据源? 说到绘制图表,可能很多人的第一反应除了是图表呈现的方式外,更关心的便是数据如何添加,记得在很多年前,哪时要绘制一个数据曲线图,一直找不到好的呈现方式,后来使用了SVG的绘图模式,不过在添加数据的时候可谓吃尽了苦头,毕竟,SVG只是一种描述语言,要动态的实现一个图表的绘制,是非常困难的.对于微软的图表控件,数据添加是一件很简单的方式,它支持多种数据添加方式,如: ·可以在图表的设计界面,在属性设置窗口中的Series属性下的Points中添加需要的数据. ·可以在图表的设计界面中,在属性中绑定一个数据源. ·可以在后台代码中,动态添加数据. ·可以在后台代码中设置一个或多个数据源,直接绑定到图表中. 在此处,我只着重讲解一下第3,4两点.对于第3点,相对来说比较简单,在后台代码中,找到要添加代码的Series,通过它下面Points的Add、AddXY、AddY等方法,即可以实现数据的添加.例如: 1.doublet; 2.for(t=0;t<=*;t+=6) 3.{ 4.doublech1=(t); 5.doublech2=2);
6.["Channel1"].(t,ch1); 7.["Channel2"].(t,ch2); 8.} 复制代码 注:代码摘自微软的例子,上例中,Chart1为图表的名字,Channel1、Channel2分别表示两个Series数据序列) 二.绑定数据? 先来看看图表控件都支持什么类型的数据绑定,根据官方文档的说法,只要是实现了IEnumerable接口的数据类型,都可以绑定到图表控件中,例如: DataView,DataReader,DataSet,DataRow,DataColumn,Array,List,SqlCommand,OleD bCommand,SqlDataAdapter,及OleDbDataAdapter对象。 对于开发来说,最常用的还是DataView、DataReader、DataSet、DataRow、Array、List 这几种类型了,有几点需要注意一下: ·图表控件支持多数据源的绑定,例如:X轴绑定一个数据集ds1,Y轴可以绑定另一个数据集ds2,当然也可以是X轴绑定到一个List数据对象,Y轴绑定到一个DataView对象等等。 ·图表控件的绑定方式一般有两种,常规绑定及交差表的绑定。 ·图表控件的Y轴数据,支持一次绑定多个值,以绘制时间、区域、使用量等之类的图形。 绑定数据的流程如下: 2008-11-1022:19:03
VB6.0中通过MSChart控件调用数据库
《VB6.0中通过MSChart控件调用数据库》 VB6.0中的MSChart控件是一个功能强大的高级图表工具,拥有丰富的图表绘制功能,可显示二维和三维的棒图、区域图、线形图、饼图等多种常用图表。近日我为了在双击图表的某个区域时将与该区域相对应的数据库的内容在DataGrid控件上显示出来,遇到了许多困难,最后用一个自定义的变量SelectSeries解决了问题,具体方法如下:设数据库名称为“学生信息”,有一Access表“学生成绩”,其内容为一个班学生的考试成绩,包括学号、姓名、成绩3个字段,成绩字段格式是字符型,值为“优”、“良”、“中”、“差”中的一个。 窗体Form1包括一个MSChart控件McScore,类型为二维饼图,用于显示每种成绩的学生数;一个ADO控件AdScore用于连接数据库;一个DataGrid控件DgScore用于以表格形式显示数据库内容。 工作过程为:双击饼图的某个区域,则DgScore显示相应成绩的学生名单。 代码如下: Option Explicit Dim SelectedSeries as Integer ′自定义变量 Dim Rs() as String ′提取记录集用的字符串数组 Private Sub Form_Load() ′设定DataGrid控件的数据源 DgScore.DataSource=″AdScore″ ′设定ADO控件的连接字串和初始的记录源,即显示内容 AdScore.ConnectString=″Provider=Microsoft.OLEDB.3.51;Persist_Security Info=False;Data Source=学生信息″ AdScore.RecordSource=″selet *from学生成绩order by成绩″ AdScore.Refresh ′预设好提取记录用的SQL语句 Rs(1)=″select*from学生成绩where成绩=″+Chr(34)+″优″+_Chr(34)+″order by成绩″ Rs(2)=″select *from学生成绩where成绩=″+Chr(34)+″良″+_Chr(34)+″order by成绩″ Rs(3)=″select *from学生成绩where成绩=″+Chr(34)+″中″+_Chr(34)+″order by 成绩″ Rs(4)=″select *from学生成绩where成绩=″+Chr(34)+″差″_Chr(34)+″order by成绩″ End Sub Private Sub McScore_SeriesSelected(Series as Integer,MouseFlags as _Integer,Cancel as Integer) SelectedSeries=Series End Sub Private Sub McScore_PointSelected(Series as Integer,DataPoint as_Integer,MouseFlags as Integer,Cancel as Integer) SelectedSeries=Series End Sub Private Sub McScore_Db1Click()
c#_ms_chart_控件使用方法汇总(附统计图)
c# ms chart 控件使用方法 第一个简单的chart:创建曲线图 chart1.Series.Clear(); Series series = new Series("Spline"); series.ChartType = SeriesChartType.Spline; series.BorderWidth = 3; series.ShadowOffset = 2; // Populate new series with data series.Points.AddY(67); series.Points.AddY(57); series.Points.AddY(83); series.Points.AddY(23); series.Points.AddY(70); series.Points.AddY(60); series.Points.AddY(90); series.Points.AddY(20); // Add series into the chart's series collection chart1.Series.Add(series); 同时显示2条曲线 // Populate series with random data Random random = new Random(); for (int pointIndex = 0; pointIndex < 10;pointIndex++) { Chart1.Series["Series1"].Points.AddY(random.Next(45, 95)); Chart1.Series["Series2"].Points.AddY(random.Next(5, 75)); } // Set series chart type Chart1.Series["Series1"].ChartType = SeriesChartType.Line; Chart1.Series["Series2"].ChartType = SeriesChartType.Spline;
MSChart控件教程
MSChart控件 这些内容是在学习过程中进行的整理,由于感到书籍资料或软件帮助中有时让人很不容易理解,特制作这个教程,以方便其他朋友学习,从新学习此控件的人的角度 来描述相应的属性,相信也能让跟我一样程度的人更容易理解,可能在学习的过程中 对某些属性与方法有理解不正确,请各位指正。 附录:
1、AllowDynamicRotation 返回目录 作用:返回或设置是否可旋转图表 注:需要图表的ChartType是3d类型才可以,当AllowDynamicRotation=True时,在图表中可按住ctrl+鼠标左键旋转图表。 示例: F列代码在窗体加载时将MSChartl设置为3d柱形图,并允许按住ctrl+鼠标左键旋转。(窗体上放一个MSChart控件) Private Sub Form_Load() With MSChart1 .chartType = VtChChartType3dBar '类型为3d柱形图,类形常数详见附录.AllowD yn amicRotati on = True '允许旋转 End With End Sub 口Forniil A ■
AllowDynamicRotation 值: 下列代码将以对话框的形式返回上面示例的 MsgBox MSChart1.AllowDy namicRotati on True
2、ChartData 返回目录 注:书中及软件帮助文档中说到数组需要变体型数值,是指如果要将数组第一个元素 作为标题,其他作为数据,那个这个数组既有字符又有数字,那么就需要一个变 体形。如果数组中并不包含标题(或是之后使用属性来赋于标题) ,那么数组是可以定义类形的,个人建议先给定数组类型,之后再使用属性来设置标题。 作用:设置:将一个数组的数据作表图表的显示数据 返回:将图表数据赋给一个数组 示例:将数组元素作为图表的显示数据 制作一个1行6列的的图表(数组的维代表图表的行,每维的元素代表列) Private Sub Form_Load() Dim 一维数组(1 To 6) '为了表示得更清楚,我们采取逐个赋值的方法 一维数组(1)= 1 一维数组(2) = 2 一维数组(3) = 3 一维数组(4) = 4 一维数组(5) = 5 一维数组(6) = 6 With MSChartl .chartType = VtChChartType2dBar '类型为3d 柱形图.ChartData = 一维数组() End With End Sub
VS使用TeeChart绘图控件
VS2010 使用TeeChart绘图控件- 之一- 控件和类的导入vs2010的用法和vc6有很大的不同,特别是在一些函数调用那里,当然。控件导入也是很不一样的 安装好控件后就可以在工程里加入teechart控件了 加入方法有如下几种: 1.添加Teechart控件 1.1 插入Teechart控件 1.1.1 插入控件 新建一个对话框工程,在对话框上点击鼠标右键,弹出的菜单里选择“插入ActiveX控件” 然后弹出的对话框里选择TeeChart控件
这时对话框就有TeeChart控件了 1.1.2 vs2010另外一种插入控件的方法
vs2010对话框设置的工具栏上就有许多控件了,若想把我们常用的控件也加到工具栏上以后使用就很方便了,下面说的这种方法就是把控件加入工具栏里。方便以后的调用 在工具栏的空白处点击右键,选择添加选项卡 这时vs就会新建一个选项卡,自己可以定义一个名称,这里命名为绘图控件 为选项卡添加项:在新建的选项卡的空白处点击右键,选择“选择项” 由于控件比较多,会耗费一定的时间打开这个选择项,别以为死机了,耐心等个几十秒吧
在打开的对话框中选择选择com标签,选择teechart控件
这样teechart控件就会在你的工具栏新加的选项里了,以后都会存在(我添加TeeChat的同时还把其他的一些控件添加进去了) 1.1.3 控件属性设置 双击控件进行相关设置 这里添加一个快速线图-Fast Line 若数据量特别大,可以在Series标签里的Format的Draw all选项去掉
在Chart标签里还可以设置坐标轴的名称属性等,这里先不详细讲述属性的设置2.为控件添加类 vs2010与vc6不一样,vs2010的控件对应的类添加相对比vc6麻烦 这里就对刚刚加入的TeeChart控件加入相关的类 2.1 添加TypeLib的mfc类 (1)选择vs菜单“项目”-“添加类”(注意这时类视图树形控件选中最顶端的父节点) (2)添加TypeLib的mfc类
mschart控件使用详解
一.数据源 说到绘制图表,可能很多人的第一反应除了是图表呈现的方式外,更关心的便是数据如何添加,记得在很多年前,哪时要绘制一个数据曲线图,一直找不到好的呈现方式,后来使用了SVG的绘图模式,不过在添加数据的时候可谓吃尽了苦头,毕竟,SVG只是一种描述语言,要动态的实现一个图表的绘制,是非常困难的.对于微软的图表控件,数据添加是一件很简单的方式,它支持多种数据添加方式,如: ·可以在图表的设计界面,在属性设置窗口中的Series属性下的Points中添加需要的数据. ·可以在图表的设计界面中,在属性中绑定一个数据源. ·可以在后台代码中,动态添加数据. ·可以在后台代码中设置一个或多个数据源,直接绑定到图表中. 在此处,我只着重讲解一下第3,4两点.对于第3点,相对来说比较简单,在后台代码中,找到要添加代码的Series,通过它下面Points的Add、AddXY、AddY等方法,即可以实现数据的添加.例如: 1. double t; 2. for(t = 0; t <= (2.5 * Math.PI); t += Math.PI/6) 3. { 4. double ch1 = Math.Sin(t); 5. double ch2 = Math.Sin(t-Math.PI/2); 6. Chart1.Series["Channel 1"].Points.AddXY(t, ch1);
7. Chart1.Series["Channel 2"].Points.AddXY(t, ch2); 8. } 复制代码 注:代码摘自微软的例子,上例中,Chart1为图表的名字,Channel 1、Channel 2分别表示两个Series数据序列) 二.绑定数据 先来看看图表控件都支持什么类型的数据绑定,根据官方文档的说法,只要是实现了IEnumerable接口的数据类型,都可以绑定到图表控件中,例如:DataView, DataReader, DataSet, DataRow, DataColumn, Array, List, SqlCommand, OleDbCommand, SqlDataAdapter, 及OleDbDataAdapter对象。 对于开发来说,最常用的还是DataView、DataReader、DataSet、DataRow、Array、List这几种类型了,有几点需要注意一下: ·图表控件支持多数据源的绑定,例如:X轴绑定一个数据集ds1,Y轴可以绑定另一个数据集ds2,当然也可以是X轴绑定到一个List数据对象,Y轴绑定到一个DataView对象等等。 ·图表控件的绑定方式一般有两种,常规绑定及交差表的绑定。 ·图表控件的Y轴数据,支持一次绑定多个值,以绘制时间、区域、使用量等之类的图形。 绑定数据的流程如下: 2008111015142478.png (44.03 K) 2008-11-10 22:19:03
C# MSChart图表控件使用介绍
C# MSChart 图表控件使用介绍 (2011-08-23 13:05:11) 转载 ▼ 标签: c mschart 图表 chart 使用介绍 分类: MSChart 图表 1、安装MSChart 控件 VS2008在默认下是没有MSChart 控件,所以我们需要下载安装。 Chart For vs2008安装需要下载4个文件: (1)dotnetfx35setup.exe (2)MSChart_VisualStudioAddOn.exe (3)MSChartLP_chs.exe (4)MSChart.exe https://www.sodocs.net/doc/447934732.html,/u/ish 然后分别安装,安装结束之后打开VS2008就可以在工具箱中看到Chart 图表控件: 2、添加MSChart 控件 为WinForm 窗体添加Chart 控件
3、设置MSChart控件的属性 设置MSChart控件属性方法两种:1、代码中设置属性;2、属性表设置属性 1、代码中设置属性 步骤1:添加引用 using System.Windows.Forms.DataVisualization.Charting; 步骤2:写入代码 namespace MSChart { public partial class Form1 : Form { public Form1() { InitializeComponent(); } private void Form1_Load(object sender, EventArgs e) { ////////////////////ChartArea1属性设置/////////////////////////// //设置网格的颜色 chart1.ChartAreas["ChartArea1"].AxisX.MajorGrid.LineColor = Color.LightGray; chart1.ChartAreas["ChartArea1"].AxisY.MajorGrid.LineColor = Color.LightGray; //设置坐标轴名称 chart1.ChartAreas["ChartArea1"].AxisX.Title = "随机数"; chart1.ChartAreas["ChartArea1"].AxisY.Title = "数值";
mschart使用说明1
介绍MSChart的常用属性和事件 MSChart的元素组成 最常用的属性包括 ChartAreas:增加多个绘图区域,每个绘图区域包含独立的图表组、数据源,用于多个图表类型在一个绘图区不兼容时。 AlignmentOrientation:图表区对齐方向,定义两个绘图区域间的对齐方式。 AlignmentStyle:图表区对齐类型,定义图表间用以对其的元素。 AlignWithChartArea:参照对齐的绘图区名称。 InnerPlotPosition:图表在绘图区内的位置属性。 Auto:是否自动对齐。 Height:图表在绘图区内的高度(百分比,取值在0-100) Width:图表在绘图区内的宽度(百分比,取值在0-100) X,Y:图表在绘图区内左上角坐标 Position:绘图区位置属性,同InnerPlotPosition。 Name:绘图区名称。 Axis:坐标轴集合 Title:坐标轴标题 TitleAlignment:坐标轴标题对齐方式 Interval:轴刻度间隔大小 IntervalOffset:轴刻度偏移量大小 MinorGrid:次要辅助线 MinorTickMark:次要刻度线 MajorGrid:主要辅助线 MajorTickMark:主要刻度线
DataSourceID:MSChart的数据源。 Legends:图例说明。 Palette:图表外观定义。 Series:最重要的属性,图表集合,就是最终看到的饼图、柱状图、线图、点图等构成的集合;可以将多种相互兼容的类型放在一个绘图区域内,形成复合图。 IsValueShownAsLabel:是否显示数据点标签,如果为true,在图表中显示每一个数据值 Label:数据点标签文本 LabelFormat:数据点标签文本格式 LabelAngle:标签字体角度 Name:图表名称 Points:数据点集合 XValueType:横坐标轴类型 YValueType:纵坐标轴类型 XValueMember:横坐标绑定的数据源(如果数据源为Table,则填写横坐标要显示的字段名称) YValueMembers:纵坐标绑定的数据源(如果数据源为Table,则填写纵坐标要显示的字段名称,纵坐标可以有两个) ChartArea:图表所属的绘图区域名称 ChartType:图表类型(柱形、饼形、线形、点形等) Legend:图表使用的图例名称 Titles:标题集合。 width:MSChart的宽度。 height:MSChart的高度。 常用事件:
并口定义及并口编程基础
并口定义及并口编程基础 一、接口定义说明 电脑的并口,通常是25针. 接口定义如下: 针方向 2,3,4,5,6,7,8,9 双向 1,14,16,17 输出 10,11,12,13,15 输入 18,19,20,21,22,23,24,25 地 功能说明: 二、并口编程基础 这些引脚,其实就是I/O口。而且是可以控制的,以软件的方式,非常简单。 在计算机内部,对应的寄存器如下: 0x378是8bit数据寄存器的地址,对应并口针的顺序是9,8,7,6,5,4,3,2 0x379是状态寄存器,11,10,12,13,15 - - - 0x37A是控制寄存器,- - - 并口中断允许位,17,16,14,1 也就是说PC的0x378可以用来做输入和输出,0x37A的低4位可以用来输出,0x379是输入。这样就可以用并口模拟很多时许,比如IIC、JTAG、SPI等等。 注意:上述的寄存器地址是以0x378为基地址的。如果基地址为0x3F0,那么他们的数据、状态、控制寄存器地址分别为0x3F0、0x3F1、0x3F2。(基地址缺省的是0x378,也可在BIOS里重新设置)
用VB编程控制并口的数据进行数据采集 悬赏分:80 - 提问时间2007-4-30 16:02问题为何被关闭 基于PC机并行口接口电路的设计 2.5 EPP模式接口电路设计 EPP(Enhanced Parallel Port)是一种与标准并行口兼容且能完成双向数据传输的协议。增强型并口(EPP)除能实现双向数据传输之外,进行了以下几个方面的扩展: 3.1 EPP模式下接口电路的数据采集系统 数据采集系统在工业测控以及试验室研究方面的应用非常广泛,随着科学技术的发展,数据采集技术被普遍认为是现代科学研究和技术发展的一个重要方面。数据采集系统正向着高精度、高速度、稳定可靠和集成化的方向发展。由于计算机技术的高速发展,基于个人计算机控制的数据采集系统的应用非常普遍;而另一方面,便携式数据采集系统在很多场合(如野外、工业现场数据样本采集等)也具有较强的优势。为适应计算机处理的需要,这样的数据采集系统往往应有与计算机通讯的接口。 3.2 EPP接口电路的软件设计 1.因为ADC0809被接成自启动方式,所以当电源接通时A/D转换开始。 2.选择采集通道,如果选择单通道采集则只选择通道一次,如果选择多通道采集则每次循环要经过通道选择。 3.选择采集速度。不同的速度使用的读数据循环方式不同,速度越快,每秒采集的数据点越多。 4.数据采集读出数据。对读出的数据进行处理,转化为所需的格式,进行显示存储。 3.2.3全程采集 将采集的数据以波形的形式显示的方法有三种,第一种方法是将数据点以一个小点的形式依次显示在一个区域中;第二种方法是使用MSChart控件;第三种是使用专门的图形显示控件。第一种方法实现比较麻烦,要把数据点的值换算成屏幕上的坐标值;第二种方法在动态显示时有闪烁的问题,显示速度快时,闪烁得非常严重。为了编程简便和达到好的显示效果,所以使用专门的图形显示控件Trend.ocx。Trend控件可用于工业监控,科学,数据采集分析等领域的数据显示、分析、打印。它能同时显示多组二维实时数据,可以生成扫描图、曲线图、折线图、逻辑图、打点图、面积图、棒图等多种图样;支持曲线任意拉伸缩放,鼠标滚动查看;自带打印功能,可以轻松将图形输出到打印机;内置数据统计分析功能,包括最小值、最大值,平均值等;可定义报警区域,指定颜色或图片;通过数据游标提供了强大的数据观察分析功能;同时提供了灵活的自定义功能,让用户轻松自定义文本、字体、颜色、刻度等。可见Trend控件功能强大,可以满足波形显示的要求。因为,VB中调用一个控件需要一定的时间,如果将每一个采集的数据都显示,则数据采集的速度受到了限制。在P4的电脑上每秒大约能显示100个数据点。为了加快显示的速度,Trend除了能一次显示一个数据点外,Trend可以一次显示一个数组中的数据点。因为读取端口和将采集数据保存到数组所用的时间比调用VB控件的速度快很多,所以通过改变数组的大小,就可以控制数据显示的速度。 3.2.4数据的保存与回放 为了将数据采集所得的有用数据保存并做进一步处理和分析,需要将采集的数据保存为文件格式。在本系统中使用一个数组来保存采集得到的数据。定义了数组data(19999),此数组中可以放入20000个数据,定义一个公有变量i,每采集一个数据i加1,将采集到的数据保存
用Chart控件绘制动态图表
用Chart控件绘制动态图表 ---- 进行程序设计时,选用一个合适的ActiveX控件,有时可大大减少编程工作量。ActiveX 控件(又称OCX)基于COM技术,作为独立的软件模块,它可以在任何程序设计语言中插入使用。本文仅以VC++为例说明Chart控件的使用。 ---- Chart控件指Mschart.ocx(5.0版)或Mschrt20.ocx(6.0 版),是Visual Studio自带的ActiveX控件之一,其属性、事件很多,功能非常强大,可实现柱状直方图、曲线走势图、饼状比例图等,甚至可以是混合图表,可以是二维或三维图表,可以带或不带坐标系,可以自由配置各条目的颜色、字体等等。 一安装和使用Chart控件 ----在用到Chart控件的项目中安装该控件:从Project->Add to Project ->Components And Controls->Registered Active Xcontrols,选择Chart控件,则ClassWizard会生成相应的C++类,其中类CMSChart是由CWnd派生来的,它是Chart 控件的主要类,其他的类全部是由COleDispatchDriver派生来,控制控件中的相应对象,完成各部分相关功能,如CvcAxis类是实现坐标轴相关功能的源代码。同时在项目的控件工具箱上会出现代表Chart控件的按钮,使用时把Chart控件按钮从工具箱拖到对话框中,调整大小即可。 ----Chart控件至少有45个属性、9个方法、49个事件,在这里就不一一列举了。 ---- 在设计中,我们可以在主要属性页里修改各属性的属性值:右击对话框窗口中的Chart控件,选择“Properties”菜单项,就会弹出主要属性页对话框,对其中各属性值进行设置。有些属性在主要属性页里没有列出,只能编程修改。另外要动态绘制图表,必须掌握对控件的编程控制。 ---- 首先在对话框类中定义控件变量,以便编程时操纵控件。如对话框类定义如下: class CAbcDlg : public CDialog{ public: CAbcDlg(CWnd*pParent = NULL); //{{AFX_DA TA(CAbcDlg) enum { IDD = IDD_ABC_DIALOG }; CMSChart m_Chart; //}}AFX_DA TA ...... }; ----ActiveX控件的属性和方法在控件内部对应唯一一个整数索引值,编程时可以通过索引来设置或获取控件的属性值,也可以通过调用控件的C++类(在这里就是CMSChart)的成员函数设置或获取控件的属性值及调用控件的方法。例如: ----在CMSChart类实现中有如下代码: CString CMSChart::GetData(){
mschart安装使用
mschart安装使用 最近需要为程序显示一些柱状图、线图之类的,查了一下微软的mschart不错,功能强大。可是自vc6.0之后mschart控件就从ms的IDE里去掉了,如果用只能自己下载安装。安装mschart需要 1 .net framewrok 3.5 sp1(注意是sp1),没有安装的话就去下载吧,完整包大概200多M 2 安装MSChart.exe MSChart_VisualStudioAddOn.exe 下载mschrt20.ocx 到C:\WINDOWS\system32目录下。命令行运行regsvr32 mschrt20.ocx注册控件 3 在vs2005之后的平台上,你要么在class view下add class->MFC Class f rom ActiveX Control然后有两个,你可以选择registy然后选择ms mschart 6.0(o led),这样只能出现一个类CMSCHART,或者选择File然后浏览mschrt20.ocx,这里面生成了很多类,你全部添加进去,最后就可以用了。 第二、你可以在一个MFC dialog上insert axtivex control或者toolbox选择choose item->com选择组件让它出现在工具箱中,这样也可以有控件。 我们自己选择生成的很多类,跟网上有示例的类函数名称上有所不同,可能会给使用带来麻烦。其实最简单的就是找到一个Demo把里面相关的CMSCHART和其它相关的十几个类都拷贝到我的工程文件夹里,再添加进来,就ok了。 网上很多例子可供参考,比如:https://www.sodocs.net/doc/447934732.html,/document/viewdoc/?id=9 59 关于遇到的一些问题。在设置图形类型的时候,m_chart.SetChartType(1|2);显示出2D曲线图,而我们用m_chart.SetChartType(16);的时候如果你只设置了m_chart. SetColumnCount(1); 就不会显示,因为16的散列图需要的是一对坐标点,你至少需要设置m_chart.SetColumnCount(2);为2。 MsChart实现无闪烁动态曲线(MFC) 最近需要用MFC做一个界面动态显示曲线,自己画坐标轴画曲线太费时间,网上也有很多已实现的动态曲线接口,但是也不太灵活。正好微软有个现成的MS Chart,功能比较全面,查了一些资料,总算实现了无闪烁的动态曲线。关于MSCh art的安装可以参考上篇文章https://www.sodocs.net/doc/447934732.html,/wy-wangyan/archive/2011/0 5/06/2038981.html
MSChart控件
一、在工程中加入 mschart 菜单->Project->Add To Project->Components and Controls->Registered ActiveX Controls->Microsoft Chart Control, version 6.0 (OLEDB) 二、在CDemoView中加入:CMSChart m_Chart 三、创建及设置m_Chart 3.1 在 CDemoView::OnCreate 中创建CMSChart // CDemoView::OnCreate() CRect rc; GetClientRect(&rc); if(!m_Chart.Create("mschart", WS_CHILD| WS_VISIBLE, rc, this, 10)) return -1; 3.2 在 CDemoView::OnSize 中调整 m_Chart 的大小,使之能随窗口大小变化而变化 // CDemoView::OnSize if( m_Chart.GetSafeHwnd() ) m_Chart.MoveWindow( 0, 0, cx, cy ); 3.3 设置 m_Chart void CDemoView::InitChart() { // 设置标题 m_Chart.SetTitleText("mschart 示例"); // 下面两句改变背景色 m_Chart.GetBackdrop().GetFill().SetStyle(1); m_Chart.GetBackdrop().GetFill().GetBrush().GetFillColor().Set(255, 255, 255); // 显示图例 m_Chart.SetShowLegend(TRUE); m_Chart.SetColumn(1); m_Chart.SetColumnLabel((LPCTSTR)"1号机"); m_Chart.SetColumn(2); m_Chart.SetColumnLabel((LPCTSTR)"2号机"); m_Chart.SetColumn(3); m_Chart.SetColumnLabel((LPCTSTR)"3号机"); // 栈模式 // m_Chart.SetStacking(TRUE); // Y轴设置 VARIANT var; m_Chart.GetPlot().GetAxis(1,var).GetValueScale().SetAuto(FALSE); // 不自动标注Y轴刻度 m_Chart.GetPlot().GetAxis(1,var).GetValueScale().SetMaximum(100); // Y轴最大刻度 m_Chart.GetPlot().GetAxis(1,var).GetValueScale().SetMinimum(0); // Y 轴最小刻度
MSCHART的使用之vb中利用MSCHART控件画二维散点图
MSCHART的使用之vb中利用MSCHART控件画二维散点图 2008年03月31日星期一 16:12 近日在学习傅立叶分解时,写了个小程序来验证自己对傅立叶分解的一些理解,为了更生动直观就需要画一些图形,以前总是用picture控件来实现,后来在网上看到VB中有个MSCHART控件可以来画很多类型的图形,就学习了一下,由于是第一次搞,所以按习惯在网上搜索相关帖子,发现没有一个很完整的关于MSCHART中二维散点图的例子,很是郁闷,经过我自己几天的努力,终于解决了这个问题.现以一个具体的例子来说明,希望我的这个例子能对大家有所帮助.这个例子是一个论坛上一位网友提出来的,但是这个问题一直到现在还没有人回答,我权当在这里回答一下吧.问题如下: 如何用VB画出我附件中的图,请各位知道的高手指点下,小弟感激不尽! 最好能根据我给的数据写出具体的源代码,或者类似的也可以。再次感谢! 上面是这个帖子的原始图形 根据此我写了下面的代码 Private Sub Form_Load() '对于二维散点图来说,第一列代表了X轴坐标,第二列代表了Y轴坐标 '因此在定义二维数据时,第二维定义为0到1,第一维代表了第几点数据,可根据数据点数变化 '下面以数据点数有21点为列子 Dim MyData(20, 1) As Double '-----x轴坐标值-----Y轴坐标值---------- MyData(0, 0) = 0: MyData(0, 1) = 180 '本句代表了:第一点数据的X轴坐标为0,Y轴坐标为180 MyData(1, 0) = 6: MyData(1, 1) = 60 MyData(2, 0) = 8: MyData(2, 1) = 60 MyData(3, 0) = 11: MyData(3, 1) = 0 MyData(4, 0) = 16: MyData(4, 1) = 0 MyData(5, 0) = 19: MyData(5, 1) = 60
微软图表控件MsChart使用指南
微软图表控件MsChart使用指南 昨天在网上看到了微软发布了.NET 3.5框架下的图表控件,第一时间抓下来看了一下,发觉功能很强劲,基本上能想到的图表都可以使用它绘制出来,给图形统计和报表图形显示提供了很好的解决办法,同时支持Web和WinForm两种方式,不过缺点也比较明显,只能在最新的开发环境中使用,需要.Net 3.5 Sp1以及VS 2008的开发环境。 下面是下载地址: mework 3.5)– 1.包含英文版,中文版。上面提供的链接是中文版的,可以更 改为英文版。 2.语言包:Microsoft Chart Controls for Microsoft .NET Framework 3.5 Language Pack 3.Microsoft .NET Framework 3.5 的Microsoft 图表控 件的语言包,包含23中语言。 4.Microsoft Chart Controls Add-on for Microsoft Visu al Studio 2008–
这个只有英文的,没找到中文的。 5.文档(Microsoft Chart Controls for .NET Framewor k Documentation)– 这个只有英文的,没找到中文的。 6.WinForm 和https://www.sodocs.net/doc/447934732.html,的例子(Samples Environment for Microsoft Chart Controls)– 这个只有英文的,没找到英文的。 7.Demo 下载:https://www.sodocs.net/doc/447934732.html,/msch art 下了它的示例程序后,运行了一下,非常的强大,可以支持各种各样的图形显示,常见的:点状图、饼图、柱状图、曲线图、面积图、排列图等等,同时也支持3D样式的图表显示,不过我觉得最有用的功能还是支持图形上各个点的属性操作,它可以定义图形上各个点、标签、图形的提示信息(Tooltip)以及超级链接、Jav ascript动作等,而不是像其它图形类库仅生成一幅图片而已,通过这些,加上微软自己的Ajax框架,可以建立一个可以互动的图形统计报表了。 一。安装
图表绘制控件MSCHART的使用方法1
VisualBasic中ActiveX控件MSChart的使用方法* 依皮提哈尔·穆罕买提,那斯尔江·土尔逊 (新疆大学数学与系统科学学院,乌鲁木齐,830046) 热依曼·吐尔逊 (新疆大学信息工程学院,乌鲁木齐,830046) 摘要:本文首先介绍了VisualBasic(简称VB)中MSChart控件的使用方法,然后通过简单的例子详细介绍了利用MSChart控件绘制Excel数据源图表的方法。 关键词:VisualBasic;MSChart控件;MicrosoftExcel数据表;图表;数据库 The Methods of Using MSChart Control Based on VB Iptihar.Muhammat,Nasirjan.Tursun (Mathematics and Systematic Science Institude of Xinjiang University,Urumqi,Xinjiang,830046) Reyima.Tursun (Information Science and Engineering Institude of Xinjiang University, Urumqi,Xinjiang,830046) Abstract:This article discusses how to use the MSChart control and how that is used in the VB project to drawing Microsoft?Excel charts. KeyWords:MSChart Control;Chartdata;Mirosoft Excel Sheets;Chart;Database 1.引言 Visual Basic中的MSChart控件是一个功能强大的高级图表工具,拥有丰富的图表绘制功能,用它来可以显示二维和三维的棒图、区域图、线形图、饼图等多种常用图表。使用MSChart控件可以按照一定的规范将数据以图表的形式绘制出来。可以通过在控件的属性页中设置数据来创建图表,也可以从其它数据源,如Microsoft Excel和Microsof Access 的电子数据表中检索出要绘制的数据。本文介绍MSChart控件使用方法的同时,主要讨论用MSChart控件绘制Excel数据源图表的实现过程。 2.使用数组和MSChart控件属性绘制图表 2.1添加MSChart控件并调整其属性 (1)先通过“工程”菜单中的“部件”命令,在控件箱里,添加Microsoft Chart Control6.0 (OLEDB)(简称MSChart) (2)MSChart控件拖动到窗体里,生成初始图表 (3)快捷菜单中的属性命令打开属性页对话框,在该对话狂里可以选择图表类型(在代码中使用ChartType属性),也可以设置图表及其X、Y轴的标题,框架等各种属性2.2使用数组和ChartData属性绘制图表 绘制图表最简单的方法就是创建数字型的数组,然后将ChartData属性设为该数组。下面介绍简单的单系列图表和复杂的多系列图表的创建方法: ------------------------------------------------------------------------------- *新疆大学校基金”应用软件程序设计”重点课程建设项目资助1
Dundas Chart控件的使用总结
Dundas Chart控件的使用总结 前段时间因为工作需要接触到Dundas Chart 控件,研究了2周时间,大体能实现需要的功能,现在对其做个大体的总结,希望能把自己理解到的地方都能够总结到位,一是方便大家上手,而来也是提高一下自身的学习到总结再到学习的一个循环学习方法吧,再次提高下本人的表达水平,不多说了,进入课题。 1.首先要拖拽一个Chart控件到设计区,在代码编写区加上引用命名空间using Dun das.Charting.WebControl; 2.每个Chart分为ChartArea区域,Sieres,Legend,Axis几个部分,都可以设置相应的属性,可以在属性编辑框中修改,也可以通过修改代码来实现; 3.绑定数据部分,可以通过Points.DataBindXY(X[],y[]); 代码 using System; using System.Data; using System.Configuration; using System.Collections; using System.Web; using System.Web.Security; using System.Web.UI; using System.Web.UI.WebControls; using System.Web.UI.WebControls.WebParts; using System.Web.UI.HtmlControls; using Dundas.Charting.WebControl; using System.Drawing; public partial class TestChart : System.Web.UI.Page { protected void Page_Load(object sender, EventArgs e) { databindXY(); ControlSet(); //databindXY(); } private void ControlSet() { //设置Chart1的相关属性 Chart1.BackGradientEndColor = Color.White; Chart1.BorderLineColor = Color.White; Chart1.BorderLineWidth = 0; Chart1.BorderSkin.FrameBackColor = Color.MediumTurquoise;
相关文档
- Chart控件的基本操作
- chart控件使用
- c#_ms_chart_控件使用方法汇总(附统计图)
- vcMschart控件的使用
- Devexpress ChartControl 控件使用笔记
- TChart用法
- vs2010chart控件使用方法
- Delphi Tchart 控件使用
- MSChart控件教程
- Chart控件说明
- MSChart控件教程
- 大白话C#--chartControl控件连接SQL Server数据库实现饼状图1
- 图表控件MsChart教程
- VB6.0中通过MSChart控件调用数据库
- VBmschart控件的使用
- 用Chart控件绘制动态图表
- Dundas Chart控件的使用总结
- 微软图表控件MsChart使用初探
- Tchart 控件使用
- VS使用TeeChart绘图控件